
In a Waterfall chart, a ‘t’ in the data sheet makes Ampler calculate a subtotal automatically, and an empty column breaks the running sum.
Quick answer: Type t in the data sheet where a subtotal should be calculated automatically; insert an empty column to break the automatic sum where a new build should start.
How to use it
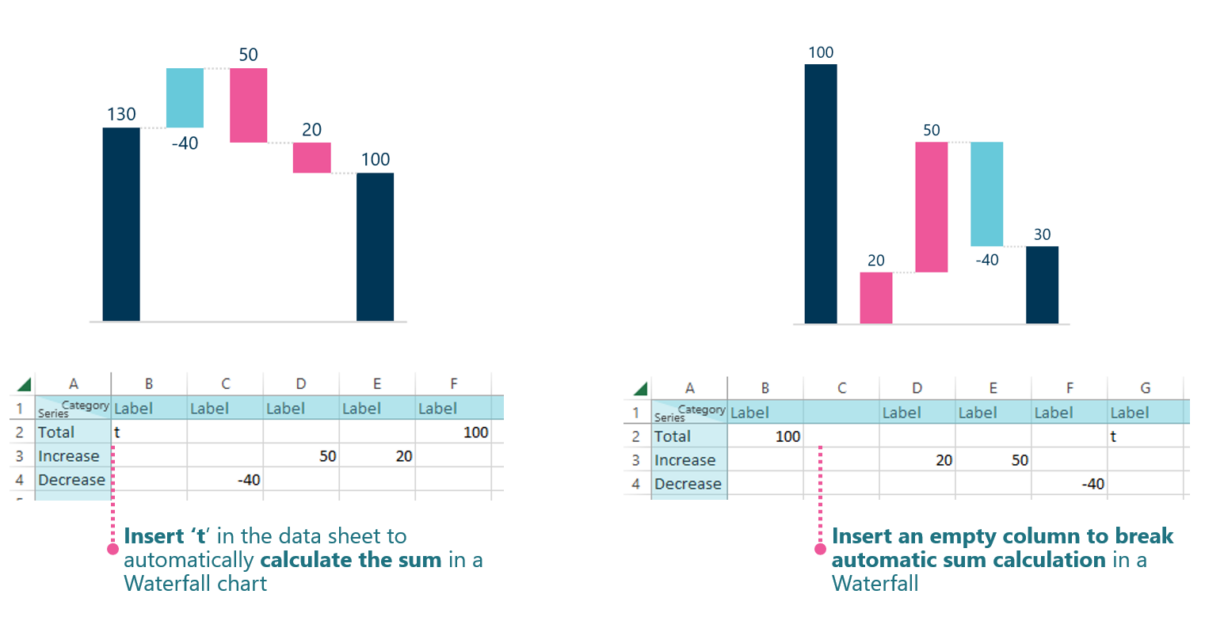
Use ‘t’ to total automatically, or an empty column to break the sum.
- Insert t in the data sheet to automatically calculate the sum at that point in a Waterfall chart.
- Insert an empty column to break the automatic sum calculation in the Waterfall.
The ‘t’ column totals the preceding steps automatically; an empty column resets the running sum so a new build begins.
When to use it
Use t where a subtotal should total the steps before it automatically; insert an empty column where the running sum should stop and a new build-up should start.
How consultants use it
A Waterfall (bridge) chart is a finance and consulting staple, and its subtotals must be correct. Three habits apply:
- Automatic, correct subtotals: a ‘t’ totals the preceding steps without a hand-typed figure
- Break where needed: an empty column starts a fresh build-up
- A trustworthy bridge: the subtotals follow the data, so the bridge always adds up
The ‘t’ and empty column give exact control over a Waterfall’s subtotals.
Tips & best practices
- Use t for subtotals so they recompute with the data.
- Insert an empty column to start a new build-up in the bridge.
- Check the bridge still balances after editing the steps.
Availability
Part of Ampler Charts, included in Ampler for PowerPoint and the Ampler Suite, on Windows desktop PowerPoint.
Frequently asked questions
How do you add a subtotal to a Waterfall chart in Ampler Charts?
Insert a t in the data sheet at that point — Ampler calculates the subtotal of the preceding steps automatically.
How do you break the running total in a Waterfall chart?
Insert an empty column in the data sheet to break the automatic sum, so a new build-up begins.
What does the ‘t’ column do in a Waterfall?
It tells Ampler to calculate a subtotal at that point automatically, rather than typing the figure.
Why use automatic subtotals in a bridge chart?
So the subtotals recompute when the steps change and the bridge always adds up correctly.