
Ampler Charts lets you build and edit a Gantt chart entirely from its data sheet, where each row is an activity — so a project plan is laid out as structured data.
Quick answer: Open the data sheet, enter the project-plan details (activities, owners, dates, and types), then close it and the Gantt updates.
How to use it
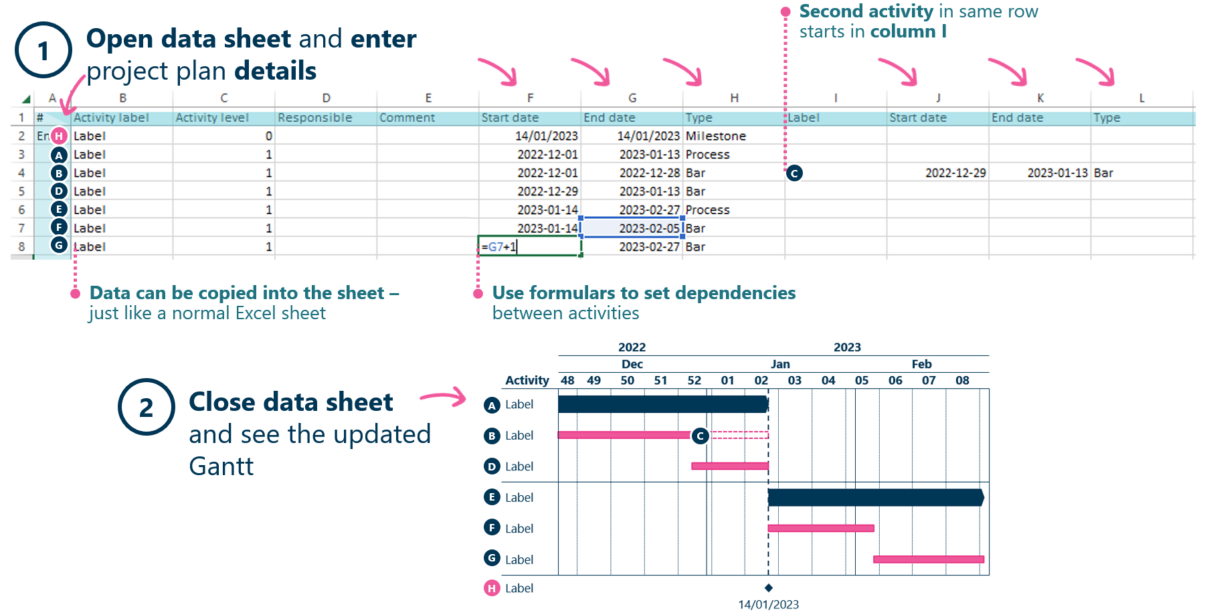
Enter the plan in the data sheet; the Gantt updates.
- Open the data sheet and enter the project-plan details — each row is an activity, with its responsible owner, comments, start and end dates, and activity type.
- Close the data sheet to see the updated Gantt chart.
The Gantt reflects the data sheet, so the whole plan is built and edited as structured rows.
When to use it
Build a Gantt through the data sheet when you’re planning a timeline — it’s the fastest way to lay out activities, owners, and dates as a structured plan rather than drawing bars by hand.
How consultants use it
A project timeline is a core consulting deliverable, and building it as data keeps it maintainable. Three habits apply:
- Plan as structured data: activities, owners, and dates are entered as rows
- Fast to build and revise: editing the sheet updates the whole Gantt
- A maintainable workplan: the plan can be adjusted as the project moves
Building a Gantt from the data sheet lays out a workplan as maintainable data.
Tips & best practices
- Enter each activity as a row with its dates and owner.
- Set the activity type (bar, process, and so on) in the data sheet.
- Use the Responsible and Comment columns to make the plan accountable.
Availability
Part of Ampler Charts, included in Ampler for PowerPoint and the Ampler Suite, on Windows desktop PowerPoint.
Frequently asked questions
How do you make a Gantt chart in PowerPoint with Ampler Charts?
Open the Gantt’s data sheet and enter each activity as a row — with its owner, dates, and type — then close the sheet to see the Gantt update.
How do you edit a Gantt chart’s activities?
Open the data sheet (click a blank area of the Gantt) and edit the activity rows; the Gantt updates automatically.
What details can you set for each Gantt activity?
The activity name, responsible owner, comments, start and end dates, and the activity type.
Does the Gantt update as you edit the data sheet?
Yes. Changes in the data sheet are shown on the Gantt automatically.