
The order of a waterfall’s categories is set in its data sheet, so rearranging the columns there rebuilds the bridge in the sequence you want.
Quick answer: Open the data sheet and rearrange the categories there — select a column and cut, then paste it into its new position (for example with the Insert and delete rows and columns functions); the chart rebuilds automatically.
How to use it
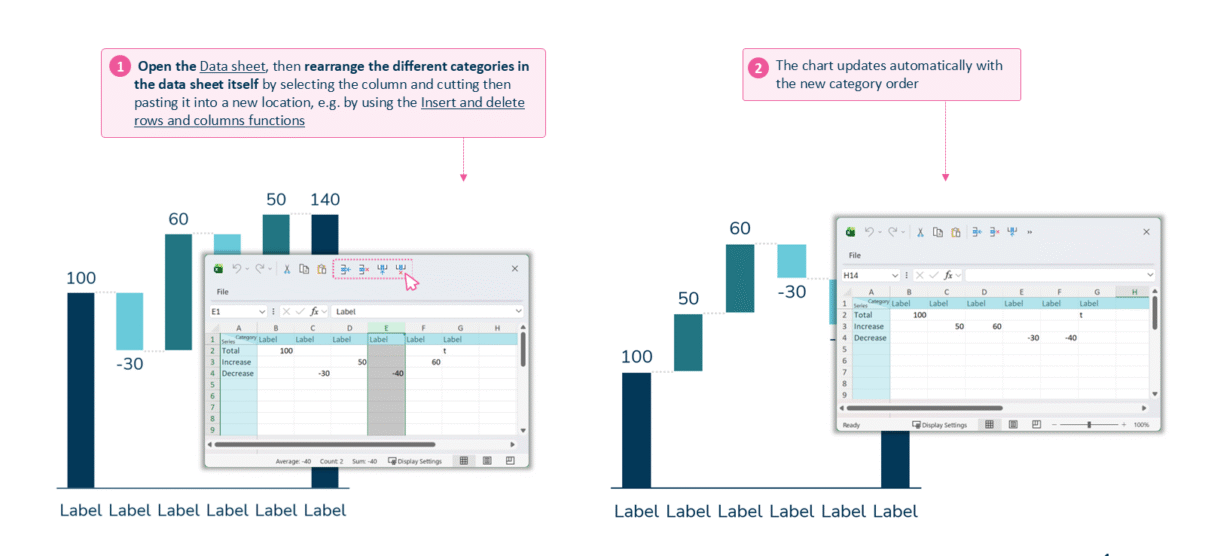
Rearrange the category columns in the data sheet to reorder the bridge.
- Open the data sheet, then rearrange the categories in the data sheet itself by selecting the column and cutting, then pasting it into a new location — for example using the Insert and delete rows and columns functions.
- The chart updates automatically with the new category order.
When to use it
Reorder the steps when the bridge should read as a logical story — a clean build from opening to closing balance, or the largest drivers grouped and up front — rather than the order the data happened to be entered.
How consultants use it
A waterfall — a ‘bridge’ to bankers and consultants — is an argument in chart form, and the order of the steps is the argument. A few practices apply:
- Sequence the story logically: order the steps so the bridge reads like arithmetic rather than detective work — a clean build where each bar follows from the one before
- Group related drivers and lead with the largest: grouping related movements and putting the biggest contributors where they can’t be missed is what makes the reconciliation land
- Edit the order as data: because the sequence lives in the data sheet, it is cut-and-paste to revise, with no redrawing
Reordering categories lets a waterfall build its story in the sequence that makes the point.
Tips & best practices
- Reorder in the data sheet — the chart follows the column order there.
- Keep any subtotal (a ‘t’ column) in the right place after reordering so the running total still adds up.
- Order the steps to build the argument: opening balance, drivers, closing balance.
Availability
Part of Ampler Charts, included in Ampler for PowerPoint and the Ampler Suite, on Windows desktop PowerPoint.
Frequently asked questions
How do you reorder the steps in a waterfall chart in Ampler Charts?
Open the data sheet and rearrange the category columns there — cut a column and paste it into its new position; the bridge rebuilds automatically.
Does reordering categories change the totals?
The bridge recalculates from the new order; keep any subtotal (‘t’) column positioned correctly so the running total still adds up.
Can you change the order without re-entering the data?
Yes. Move the columns in the data sheet with cut and paste, or the insert and delete rows and columns functions.
What order should waterfall steps be in?
Order them to tell the story — usually the opening balance, the drivers in a deliberate sequence with the largest grouped up front, then the closing balance.