
Ampler Charts can paste an Excel range into PowerPoint as a live linked table, so the figures on the slide stay tied to the workbook they came from rather than being retyped.
Quick answer: In Excel, copy the range (Ctrl+C); in PowerPoint, open the three-dot menu and select Paste table from Excel. To update it later, click Refresh from source — linked tables do not update on their own.
How to use it
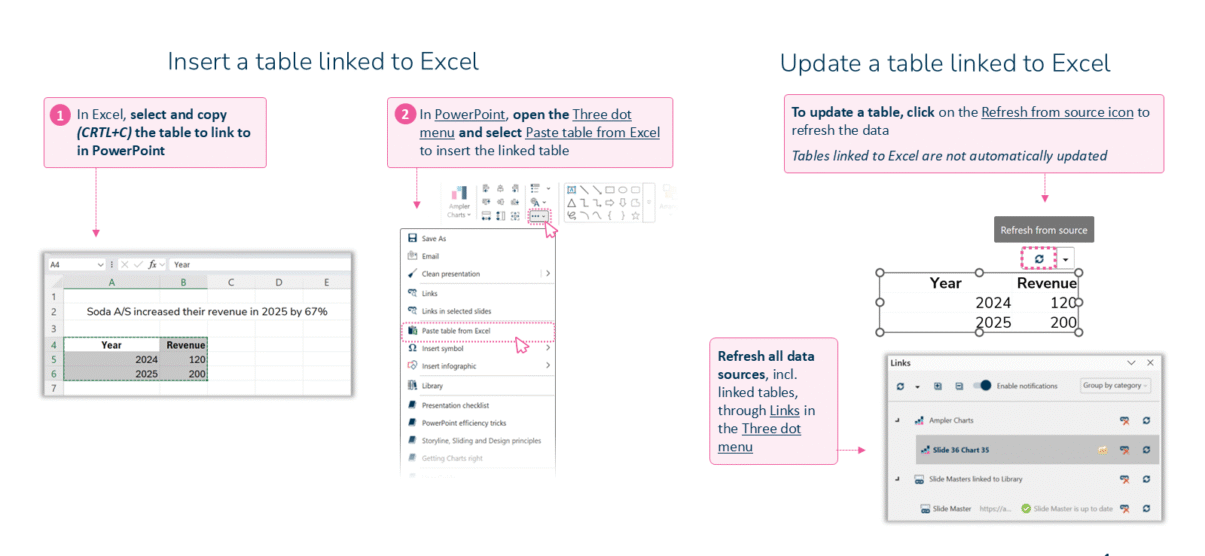
Copy the range in Excel, then Paste table from Excel in PowerPoint.
- In Excel, select and copy (Ctrl+C) the table you want to link to in PowerPoint.
- In PowerPoint, open the three-dot menu and select Paste table from Excel to insert the linked table.
- To update the table later, click the Refresh from source icon — tables linked to Excel are not updated automatically.
Refresh all data sources at once, including linked tables, through Links in the three-dot menu.
When to use it
Link a table when the exact figures matter and already live in Excel — a KPI summary, a small financials block, a data appendix — so the slide always shows the model’s current numbers and never a stale hand-typed copy.
How consultants use it
Retyping numbers onto a slide is one of the most common sources of error in a deck, and consultants design that risk out. A few practices apply:
- Let Excel stay the master: the table reads from the linked range, so the workbook remains the single source of truth and the slide cannot silently disagree with it
- Eliminate manual re-entry: a change in the model is refreshed, not re-keyed, which removes the transcription errors that creep in under deadline
- Keep it traceable: because the figures trace back to a specific range, the table can be sourced and checked the way a client review expects
A linked table keeps a slide’s hard numbers tied to — and checkable against — the model behind them.
Tips & best practices
- Linked tables don’t refresh on their own — click Refresh from source, or use Links, to update.
- Keep the linked range tidy in Excel so the pasted table stays clean on the slide.
- Refresh linked tables in the same pass as the charts before a review, so the whole slide agrees.
Availability
Part of Ampler Charts, included in Ampler for PowerPoint and the Ampler Suite, on Windows desktop PowerPoint.
Frequently asked questions
How do you insert a linked Excel table in Ampler Charts?
Copy the range in Excel (Ctrl+C), then in PowerPoint open the three-dot menu and select Paste table from Excel.
Do linked tables update automatically?
No. Click Refresh from source on the table, or refresh everything through Links in the three-dot menu.
How do you update a table linked to Excel?
Select the table and click the Refresh from source icon to pull the current values from the workbook.
What’s the difference between a linked table and a linked chart?
Both stay tied to Excel; a table shows the figures themselves while a chart visualises them, and both refresh the same way from the Links panel.