
A stacked area chart shows how a total changes over time while revealing each component’s contribution — like a line chart with the areas filled and stacked. Ampler Charts builds it natively in PowerPoint, alongside the 100% stacked area variant; for exact category comparison, a stacked column reads more precisely.
Quick answer: Click Ampler Charts and select Stacked Area, drag the chart to size, then enter your data — each series is a filled area stacked into the total, and the top edge is the overall trend.
How to create it
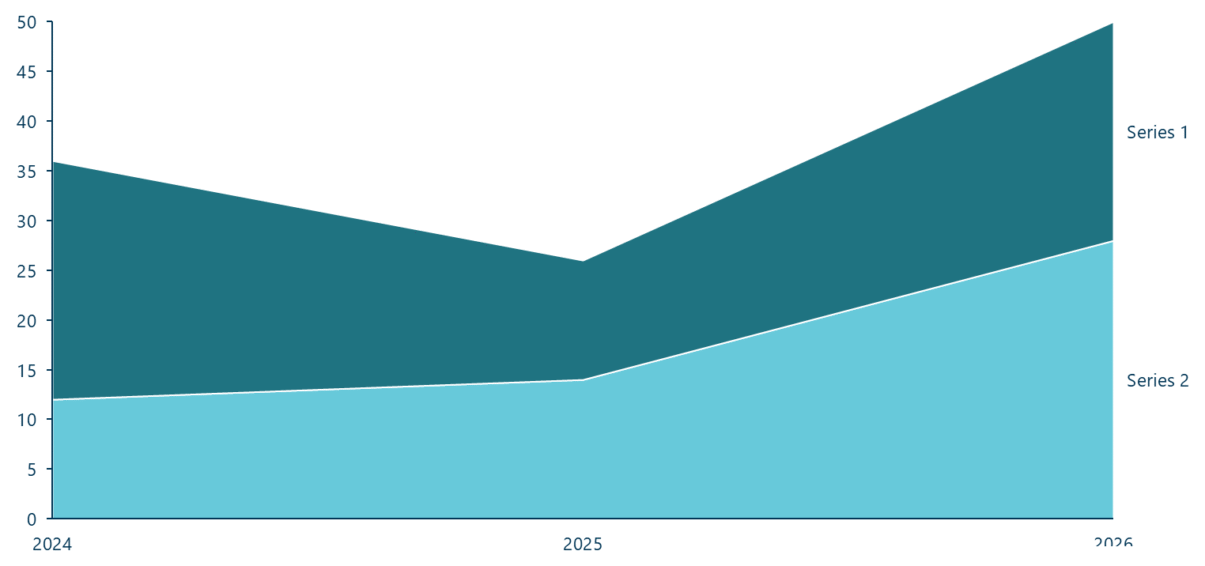
A stacked area chart: filled areas stacked to show a total and its parts over time.
- Click Ampler Charts in the ribbon and select Stacked Area from the chart menu.
- Left-click and drag the chart to the size you want — or hold Ctrl to place it in a pre-defined position.
- Enter your data in the data sheet: each series stacks as a filled area, and the top edge of the stack is the category total.
When to use it
Use a stacked area when you want to show a total trending over time and how its parts contribute — two to five series that sum to a meaningful whole. If you need exact values per period, a stacked column is better — a moving baseline makes areas hard to read precisely; if only the mix matters, use a 100% stacked area.
How consultants use it
The stacked area is for a total-over-time story with its build. A few practices apply:
- Base the most important series: put the key series at the bottom so its baseline is the axis and you can track its absolute level, not just its band
- Keep the bands few: two to five series read cleanly; beyond five to seven the bands get too thin, so group a long tail into an ‘Other’
- Read it as a trend, not a table: areas give a quick sense of contribution over time, not exact values — use a column chart when precision matters
A stacked area shows a total moving over time and what is driving it — kept to a few series.
Tips & best practices
- Put the most important series at the base so its level stays trackable against the axis.
- Keep to two to five series and group small ones into an ‘Other’.
- Use a stacked column when readers need exact values per period.
What you can add to this chart
Decorators and elements you can layer onto a stacked area chart in Ampler Charts:
Availability
Part of Ampler Charts, included in Ampler for PowerPoint and the Ampler Suite, on Windows desktop PowerPoint.
Frequently asked questions
What is a stacked area chart?
A stacked area chart is a line chart with the areas beneath the lines filled and stacked, so the top edge shows a total over time and the bands show each series’ contribution.
How do you make a stacked area chart in PowerPoint?
In Ampler Charts, click Ampler Charts, select Stacked Area, drag it to size, then enter your data — each series stacks as a filled area.
What’s the difference between a stacked area and a line chart?
A line chart shows independent trends with no meaning to the space between lines; a stacked area fills and stacks them so the total and each part’s contribution are both shown.
When should you use a stacked area chart?
When a total trends over time and you also want to show how its two to five components contribute — and exact per-period values aren’t essential.