
Ampler Charts adds a value line to a chart — a horizontal reference line at a value you set — to mark a target, budget, or benchmark against the data.
Quick answer: Right-click the chart and select Add value line; drag it into position or right-click and choose Set value; left-click the line to format it.
How to use it
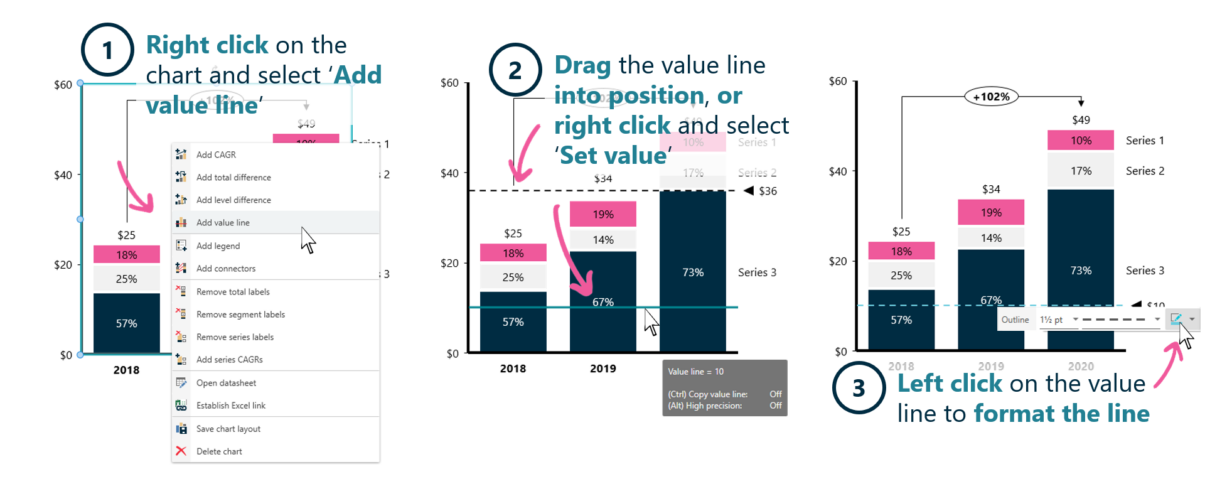
Add a value line, then set its value and format it.
- Right-click on the chart and select Add value line.
- Drag the value line into position, or right-click and select Set value.
- Left-click on the value line to format the line.
The value line sits at the value you set, so the data can be read against a reference such as a target or a prior-year figure.
When to use it
Add a value line to mark a target, threshold, or benchmark against the data — a budget, a prior-year figure, or a break-even level — so the reader sees the data relative to the reference.
How consultants use it
A reference line turns raw values into a judgement — above or below target. Three habits apply:
- Mark the reference: a target, budget, or benchmark is drawn on the chart
- Read data against it: the exhibit shows performance relative to the line, not just in absolute terms
- Label it clearly: the line says what it represents so the comparison is unambiguous
A value line lets a chart be read against a target or benchmark.
Tips & best practices
- Set the exact value with Set value rather than dragging by eye.
- Label the line so its meaning is clear.
- Keep the line subtle so it references the data without dominating it.
Availability
Part of Ampler Charts, included in Ampler for PowerPoint and the Ampler Suite, on Windows desktop PowerPoint.
Frequently asked questions
How do you add a target line to a chart in PowerPoint?
Right-click the chart in Ampler Charts and select Add value line, then set its value with Set value and format it. The line marks a target or benchmark on the chart.
What is a value line on a chart?
A horizontal reference line at a value you choose — a target, budget, or benchmark — so the data can be read relative to it.
How do you set the exact value of the line?
Right-click the value line and choose Set value to enter the exact figure rather than positioning it by eye.
How do you format a value line?
Left-click the value line to change its formatting, such as the line style and weight.