
Ampler Charts can add a ridge line to a Mekko chart — a line that traces the top of every column so the value profile reads across the chart, even though the columns are different widths. It works on the Mekko and 100% Mekko chart, natively in PowerPoint.
Quick answer: Right-click the plot area and toggle on Ridge line — a line is drawn across the tops of the columns, showing the value profile of the Mekko at a glance.
How to add it
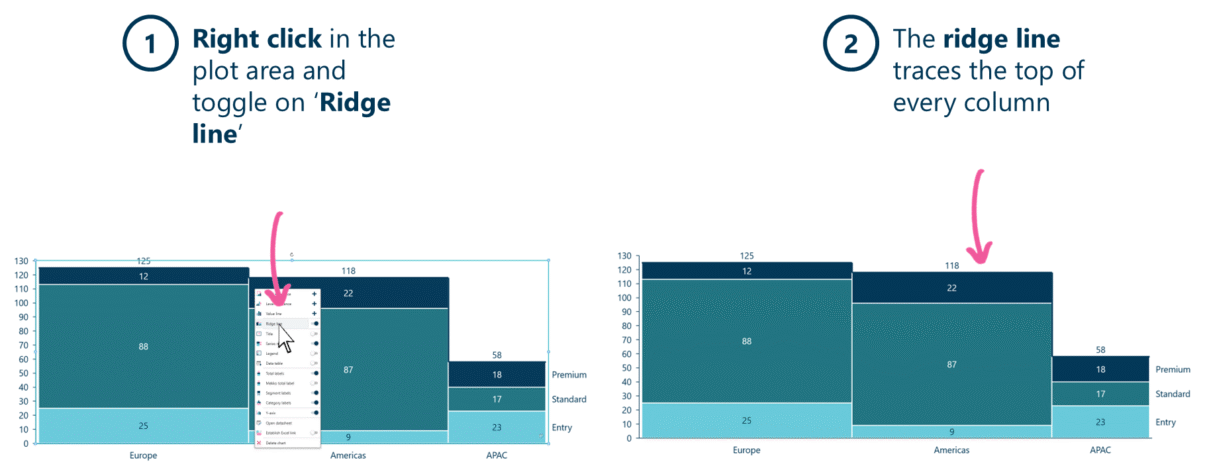
Toggle on Ridge line to trace the top of every column across the Mekko.
- Right-click in the plot area of the Mekko chart and toggle on Ridge line.
- The ridge line traces the top of every column, showing the profile across the chart.
When to use it
A Mekko encodes two things at once — column width (the weight or size) and column height (the value). Because the widths differ, comparing heights by eye is hard; the ridge line draws the skyline so the trend in value across the columns reads immediately.
How consultants use it
A Mekko is a dense exhibit, and the ridge line is what keeps the value story legible on top of the weighting. A few practices apply:
- Use it when the heights carry the message: the ridge line makes the rise and fall of value across columns readable when the varying widths would otherwise obscure it
- Direct-label the ends: note the first and last column values so the reader sees the start-to-end move, not just the shape
- Pair it with the total: the ridge line shows the profile; the Mekko total label sizes the whole — together they tell shape and scale
On a chart doing two jobs at once, the ridge line is what makes the second one — the value trend — land.
Tips & best practices
- Turn it on when the column heights are part of the argument, not just the widths.
- Combine it with the Mekko total label and segment labels for shape, scale and detail.
- It works on both the Mekko and the 100% Mekko.
Availability
Part of Ampler Charts, included in Ampler for PowerPoint and the Ampler Suite, on Windows desktop PowerPoint.
Frequently asked questions
How do you add a ridge line to a Mekko chart in PowerPoint?
In Ampler Charts, right-click the Mekko chart’s plot area and toggle on Ridge line — a line is drawn across the tops of all the columns.
What does a ridge line show?
It traces the top of every column in a Mekko, drawing the value profile across the chart so you can read where value peaks and dips despite the columns having different widths.
How is a ridge line different from a line chart?
A ridge line is an overlay on a Mekko that connects the tops of its columns; a line chart is a separate chart type. The ridge line reads the Mekko’s heights without adding a second chart.
Can I add a ridge line to a 100% Mekko?
Yes — the ridge line works on both the standard Mekko and the 100% Mekko chart.