
Ampler Charts can add a bubble size legend to a bubble chart — a reference bubble that shows what the sizes mean, so the third dimension is readable rather than decorative. It works on bubble charts, natively in PowerPoint.
Quick answer: Right-click the chart and toggle on Bubble size legend — a reference bubble is shown so the reader can read what each bubble’s size represents.
How to add it
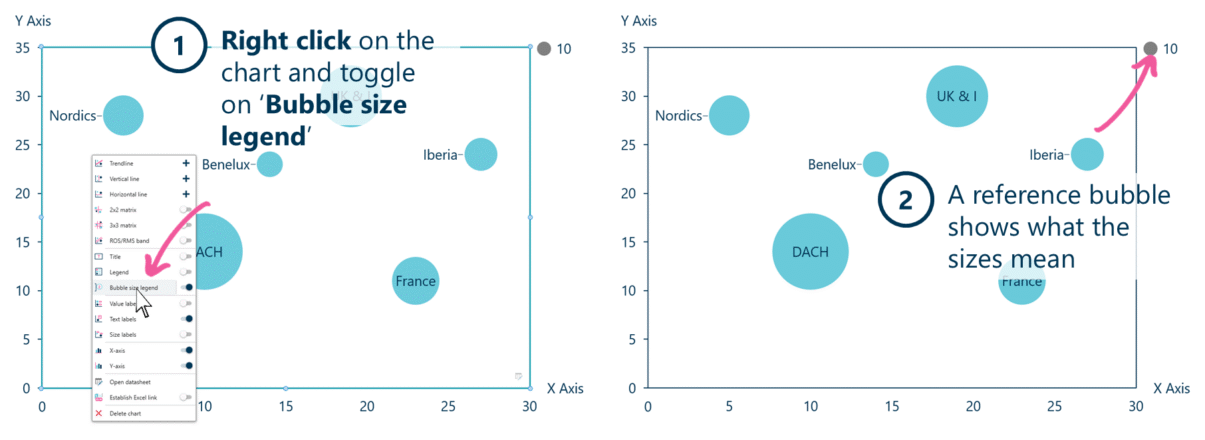
Toggle on Bubble size legend to show a reference bubble for the sizes.
- Right-click on the bubble chart and toggle on Bubble size legend.
- A reference bubble shows what the sizes mean.
When to use it
A bubble chart encodes three variables — position on x, position on y, and bubble size. Without a key, that third dimension is ambiguous. The size legend gives the reader a reference bubble to read area against, so size can carry real data — revenue, headcount, market size — and be trusted.
How consultants use it
On a bubble chart the size is data, and the size legend is what makes it honest and readable. A few practices apply:
- Never leave size unexplained: a bubble’s area is meaningless without a key; the legend is what lets the audience read the third variable instead of guessing at it
- Use a round reference value: a clean reference size (say 100, or £1bn) is the easiest for the eye to scale the other bubbles against
- It is essential on a profitability exhibit: on an ROS/RMS-style bubble chart where size is sales, the legend is what lets the audience weigh each business correctly
Size only counts as data when the reader can decode it — the legend is what turns bubble area into a number.
Tips & best practices
- Always add it when bubble size carries data, not just for decoration.
- Keep the reference value round so the eye can scale the other bubbles easily.
- Pair it with value, text and size labels for fully self-explaining points.
Availability
Part of Ampler Charts, included in Ampler for PowerPoint and the Ampler Suite, on Windows desktop PowerPoint.
Frequently asked questions
How do you add a bubble size legend in PowerPoint?
In Ampler Charts, right-click the bubble chart and toggle on Bubble size legend — a reference bubble appears showing what the sizes represent.
What does a bubble size legend show?
It shows a reference bubble with a known value, so the reader can read what each bubble’s size means — the third dimension of a bubble chart, such as revenue or headcount.
Why does a bubble chart need a size legend?
Because bubble size encodes a variable; without a key the reader can’t tell what a big bubble means. The legend makes the third dimension readable and the chart honest.
Can I set the reference bubble’s value?
The legend shows a reference bubble for the size scale; keep its value round so the other bubbles are easy to compare against it.