
Ampler Charts can add a percent indicator to a 100% chart — a 0–100% scale beside the columns so the composition reads straight off the percentage axis. It works on the 100% stacked column and bar, 100% stacked area and 100% Mekko charts.
Quick answer: Right-click the chart and toggle on Percent indicator — a 0–100% scale is shown beside the columns so each segment’s share can be read off the axis.
How to add it
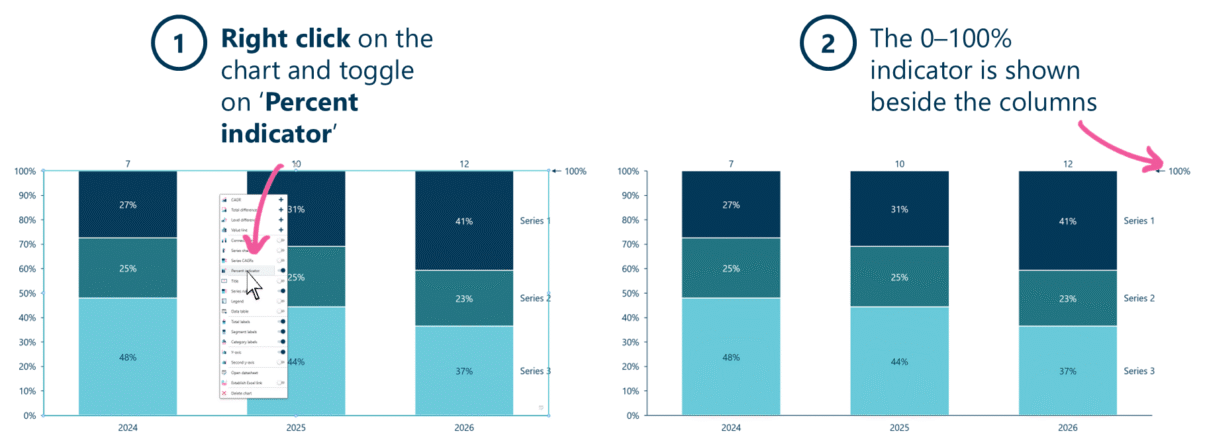
Toggle on Percent indicator to show the 0–100% scale beside the columns.
- Right-click on the 100% chart and toggle on Percent indicator.
- The 0–100% indicator is shown beside the columns.
When to use it
A 100% chart shows mix, not level — every column is the same height and only the split varies. The percent indicator anchors the eye to the 0–100 scale, so a reader can read any segment’s share off the axis instead of estimating it. Use it whenever the argument is share or mix.
How consultants use it
The 100% chart is the standard way consultants show composition, and the percent indicator is what makes the shares readable. A few practices apply:
- Keep the reader on the percentage scale: the indicator lets the audience read a share straight off the axis rather than guessing it from segment size
- Hold the segment order steady: keep the stack order the same across columns so the eye can track a segment’s share moving over time
- Add the numbers where they matter: pair the indicator with segment labels on the segments that carry the point, for the exact figure
On a mix chart, the percent indicator is the difference between a share the reader can read and one they have to estimate.
Tips & best practices
- It is for 100% variants only — on an absolute stacked chart, use a value axis instead.
- Combine it with segment labels, and with series shares when a group of segments carries the message.
- Keep the stack order consistent across columns to make a mix-shift story readable.
Availability
Part of Ampler Charts, included in Ampler for PowerPoint and the Ampler Suite, on Windows desktop PowerPoint.
Frequently asked questions
How do you add a percent indicator to a 100% stacked chart in PowerPoint?
In Ampler Charts, right-click the 100% chart and toggle on Percent indicator — a 0–100% scale appears beside the columns.
What is the percent indicator on a 100% chart?
It is a 0–100% scale shown beside a 100% stacked chart, so each segment’s share of the column can be read directly off the axis rather than estimated.
When should you use a percent indicator?
Use it whenever the message is composition or mix — it keeps the reader on the percentage scale so segment shares are read, not guessed.
Can I use the percent indicator on a 100% Mekko?
Yes — it works on the 100% stacked column, bar and area charts and on the 100% Mekko.