
Ampler Charts can add a process bar to a Gantt activity row — a solid bar that shows an activity running over a span of time, sized and positioned exactly to its dates.
Quick answer: Right-click a specific activity row and select Process to insert a process bar, then select it and drag the left and right handles to set its start date and duration, and the top or bottom handles to set its width.
How to use it
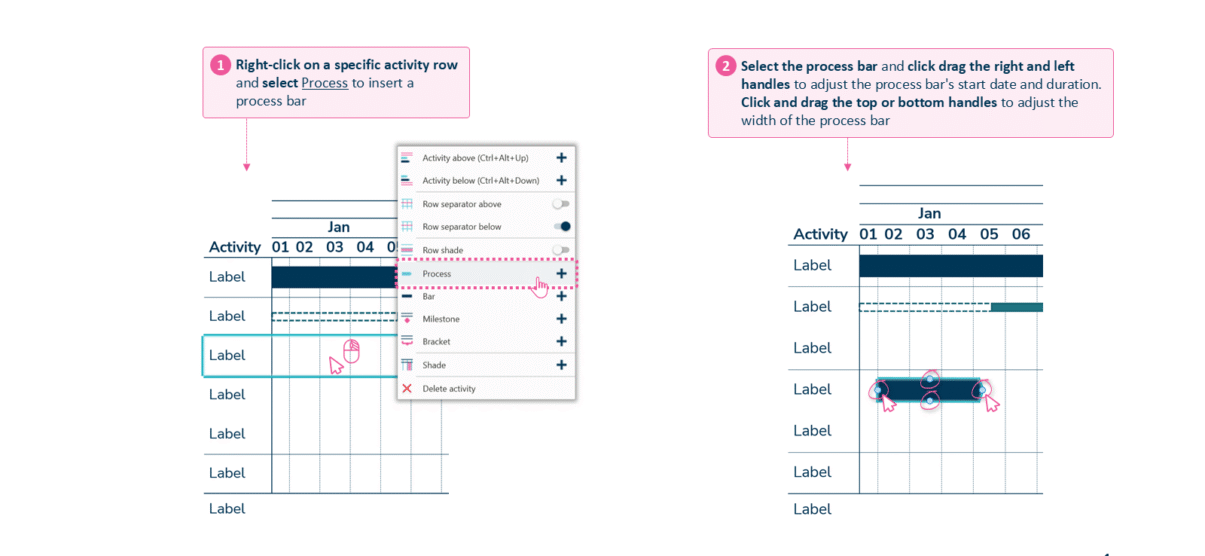
Right-click an activity and select Process, then drag the handles to set the dates and width.
- Right-click a specific activity row and select Process to insert a process bar.
- Select the process bar, then click and drag the right and left handles to adjust its start date and duration, and the top or bottom handles to adjust its width.
When to use it
Use a process bar for an activity that runs continuously over a period — a workstream, a build phase, an ongoing task — as distinct from a milestone (a point-in-time event) or a lighter bar.
How consultants use it
A workplan reads clearly when each activity type has its own consistent visual mark, and consultants keep that language tight. A few practices apply:
- Match the mark to the activity: use a process bar for something that runs over a span, a milestone for a point-in-time event, and keep each type visually distinct
- Size it to the real dates: the handles set the start, duration, and width, so the bar reflects the actual timeline rather than an approximate block
- Keep the visual language consistent: using the same marks the same way across the plan is what lets a steering committee read it at a glance
A process bar gives an ongoing activity a clear, correctly-dated place on the workplan.
Tips & best practices
- Drag the left and right handles for the dates, and the top or bottom handles for the width.
- Use a process bar for a span of work and a milestone for a single date.
- Keep activity types consistent across the plan so the Gantt reads as one language.
Availability
Part of Ampler Charts, included in Ampler for PowerPoint and the Ampler Suite, on Windows desktop PowerPoint.
Frequently asked questions
How do you add a process bar to a Gantt chart in Ampler Charts?
Right-click a specific activity row and select Process to insert a process bar, then drag its handles to set the dates and width.
How do you change a process bar’s start date and duration?
Select the process bar and drag its left and right handles to set the start date and duration.
How do you make a process bar thicker or thinner?
Select the process bar and drag its top or bottom handles to adjust its width.
What’s the difference between a process bar and a milestone on a Gantt chart?
A process bar shows an activity running over a span of time, while a milestone marks a single point in time; pick the mark that matches the activity.