
Cells in a Gantt’s Responsible or Comment column can be shown as a Harvey ball or a checkbox, turning a status column into an at-a-glance progress marker.
Quick answer: Right-click a row in the Responsible or Comment column and select Switch to Harvey ball to show a degree of progress, or Switch to checkbox to show a done-or-not status.
How to use it
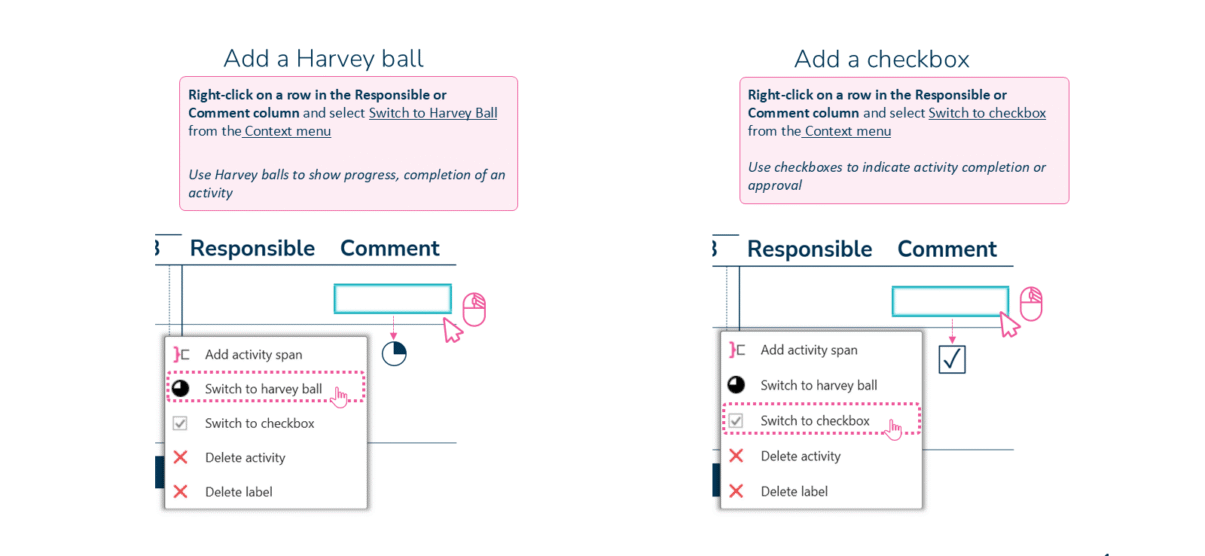
Right-click a Responsible or Comment cell to switch to a Harvey ball or checkbox.
- Right-click a row in the Responsible or Comment column and select Switch to Harvey ball from the context menu — use Harvey balls to show progress or completion of an activity.
- Alternatively, right-click a row and select Switch to checkbox — use checkboxes to indicate completion or approval.
When to use it
Use a Harvey ball for a degree of progress (quarter, half, three-quarters, full) and a checkbox for a simple done-or-not or approved status — matching the marker to the kind of status being reported.
How consultants use it
The Harvey ball was invented at Booz Allen Hamilton in the 1970s and is a consulting staple for showing qualitative status; used well, it makes a status column read at a glance. A few practices apply:
- Use Harvey balls for degree, checkboxes for done: a Harvey ball shows partial progress on its standard five steps — empty, quarter, half, three-quarters, full — while a checkbox shows an unambiguous complete or approved
- Keep the fill meaning one thing: apply the ball consistently to the criterion you’re rating, such as progress or completeness, rather than loosely as ‘more’ or ‘less’
- Let the Gantt double as a status tracker: a status column turns a timeline into something a steering committee can read without a separate report
Harvey balls and checkboxes turn a Gantt’s status column into a clear, at-a-glance progress view.
Tips & best practices
- Use Harvey balls for degrees of progress and checkboxes for a done-or-not status.
- Apply them in the Responsible or Comment column, not the timeline itself.
- Right-click again to switch a cell back to text when you need a written note.
Availability
Part of Ampler Charts, included in Ampler for PowerPoint and the Ampler Suite, on Windows desktop PowerPoint.
Frequently asked questions
How do you add a Harvey ball to a Gantt chart in Ampler Charts?
Right-click a row in the Responsible or Comment column and select Switch to Harvey ball from the context menu.
How do you add a checkbox to a Gantt chart?
Right-click a row in the Responsible or Comment column and select Switch to checkbox to show a completion or approval status.
When should you use a Harvey ball versus a checkbox?
Use a Harvey ball for a degree of progress and a checkbox for a simple done-or-not or approved status.
What is a Harvey ball?
A round ideogram filled from empty to full in five steps, used in consulting to show qualitative status such as progress or completion at a glance.