
Ampler Charts labels the series directly on the chart, so each series is named next to its data rather than in a separate legend.
Quick answer: Right-click the chart and select Add series labels; or Shift-select the series in the legend and drag them onto the chart.
How to use it
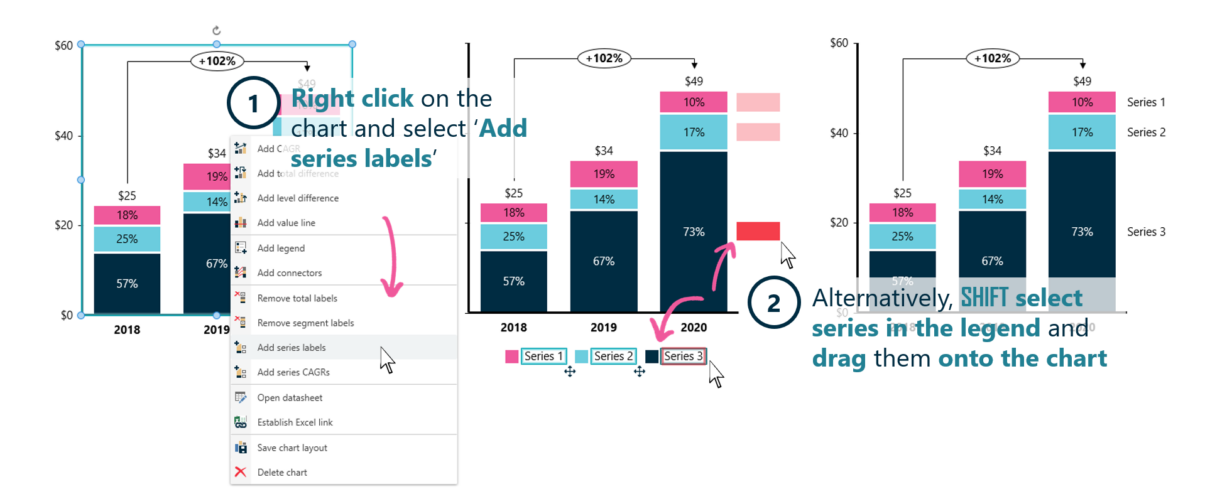
Right-click to add series labels next to the data.
- Right-click on the chart and select Add series labels.
- Alternatively, Shift-select the series in the legend and drag them onto the chart.
Each series is labelled next to its own data, so the reader identifies it without crossing to a legend.
When to use it
Label series directly when there are few enough that the labels don’t collide — it’s more readable than a separate legend the eye has to cross-reference, and it’s the preferred treatment on a clean exhibit.
How consultants use it
Direct labelling is a hallmark of a well-made chart — the name sits with the data. Three habits apply:
- Name at the data: each series is labelled next to its line or column
- No cross-referencing: the reader identifies a series without hunting a legend
- Best for a few series: direct labels work when they don’t overlap
Direct series labels make a chart readable without a legend.
Tips & best practices
- Use direct labels rather than a legend when the series are few.
- Move labels that collide — see Move series labels.
- Fall back to a legend when there are too many series to label directly.
Availability
Part of Ampler Charts, included in Ampler for PowerPoint and the Ampler Suite, on Windows desktop PowerPoint.
Frequently asked questions
How do you label chart series without a legend?
Right-click the chart in Ampler Charts and select Add series labels, or drag the series from the legend onto the chart. Each series is named next to its data.
Is it better to label series directly or use a legend?
Direct labels are usually clearer when there are few series, because the reader doesn’t have to cross-reference a legend. Use a legend when there are many series.
How do you move a series label that overlaps?
Drag it to reposition; hold Ctrl to free-float it — see Move series labels.
How do you turn legend entries into series labels?
Shift-select the series in the legend and drag them onto the chart.