Mekko Charts: How to Make Them and How to Use Them
Have you often seen a mosaic-like chart in a consultant slide deck and wondered what is it? And why do they use them so frequently? Can’t find them in PowerPoint and Excel? Fear not – they simply aren’t there! But there are some other options for making Mekko charts!
All this and more will be explained in this comprehensive guide about everything Marimekko chart, so you can learn to master making mekko charts – let’s start with the basics.
What are Mekko Charts AKA Marimekko Charts
A Mekko chart aka Marimekko chart or mosaic plot, is a type of data visualization in the form of a column chart with no gaps and variable column widths. It combines the features of a column chart and a stacked column chart, allowing for the comparison of relative proportions of categories across two variables simultaneously.
There are two types of Mekko Charts:
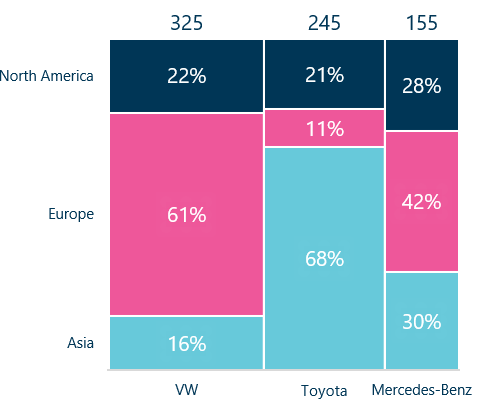
100% Mekko Chart: A chart where the columns all have the same height but have variable widths. This type of chart emphasizes the proportional distribution of categories within each variable while maintaining consistent height across all columns. The chart is shown in the image below.
100 % mekko chart
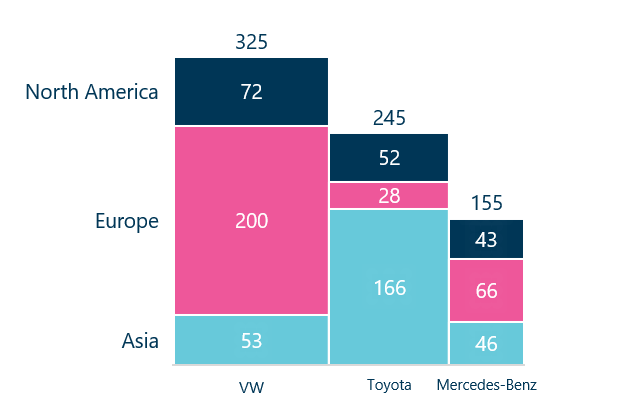
Bar Mekko Chart: A chart with columns that have variable heights and widths. This type of chart allows for the comparison of both the relative proportions of groups within each variable and the overall magnitude of each category across variables.
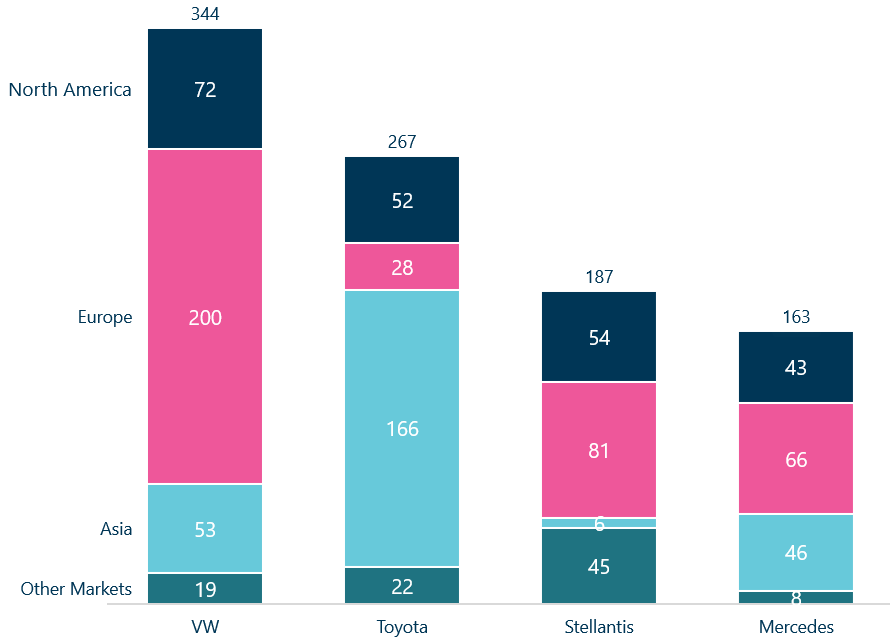
Bar Mekko Chart
Let’s break it down some more:
The Height of Bars represents a variable, often used to subdivide the width further. Like the width, the height varies. The height in the former example represents the market share in each region.
The Width of the Bars represents another variable, such as a category. The width can vary to reflect quantity of each category. In this example it represents the revenue of the company.
The Area: Each segment’s area within the column represents its percentage of the total data. Calculated as the product of the height and width, it shows the segment’s proportional contribution. Total revenue of the chart is $725 billion. $200 billion, or 61% of Volkswagens revenue, fills about 27% of the total chart area, indicating its relative share.
Mekko charts are especially useful for comparing relative sizes of proportions within and across categories. Therefore, they are commonly used by consultants because they convey extensive information in a single chart, making them ideal for market share analysis, budget allocation and financial analysis.
When to Utilize Mekko Charts and When to Avoid Them
The advantages of Mekko charts are that they’re essentially variable-width column charts, accommodating data with varying magnitudes. Unlike standard column charts that only depict data through height, Mekko charts offer insights through both height and width. This versatility can also cause confusion, so they should be used cautiously.
The following list provides key areas where these charts are useful:
Ideal for comparing relative proportions of categories across multiple variables (e.g. Revenue Breakdown by Product and Sales Channel)
Suitable to show how individual components contribute to a total or how a whole is divided into parts
Provide a clear overview by condensing multiple data points into a single chart, offering a holistic view
However, in some cases, they are better to avoid:
If the data is simple, a column chart or pie chart are more appropriate
If there are too many categories or groups, then the chart becomes to cluttered
If you want to show
If data has a complex relationship, then a two-dimensional space may be too limited
Use Case of a Mekko Chart: Relative Market Share of Car Companies
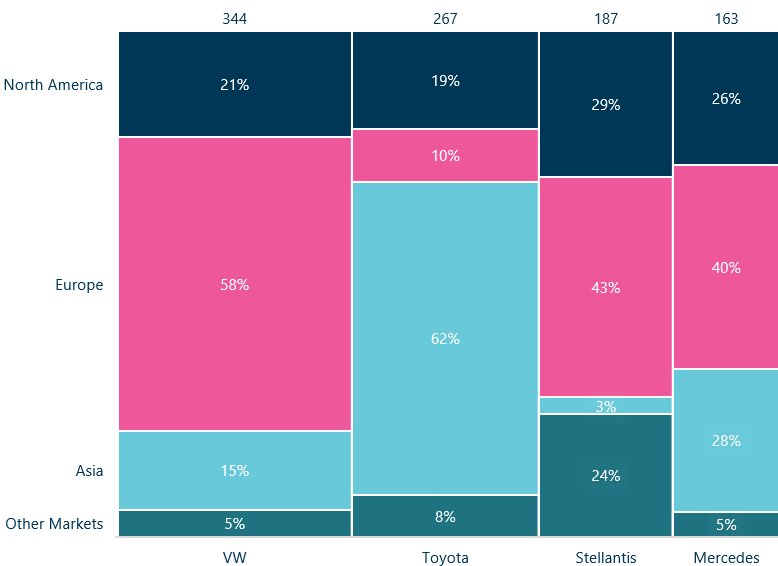
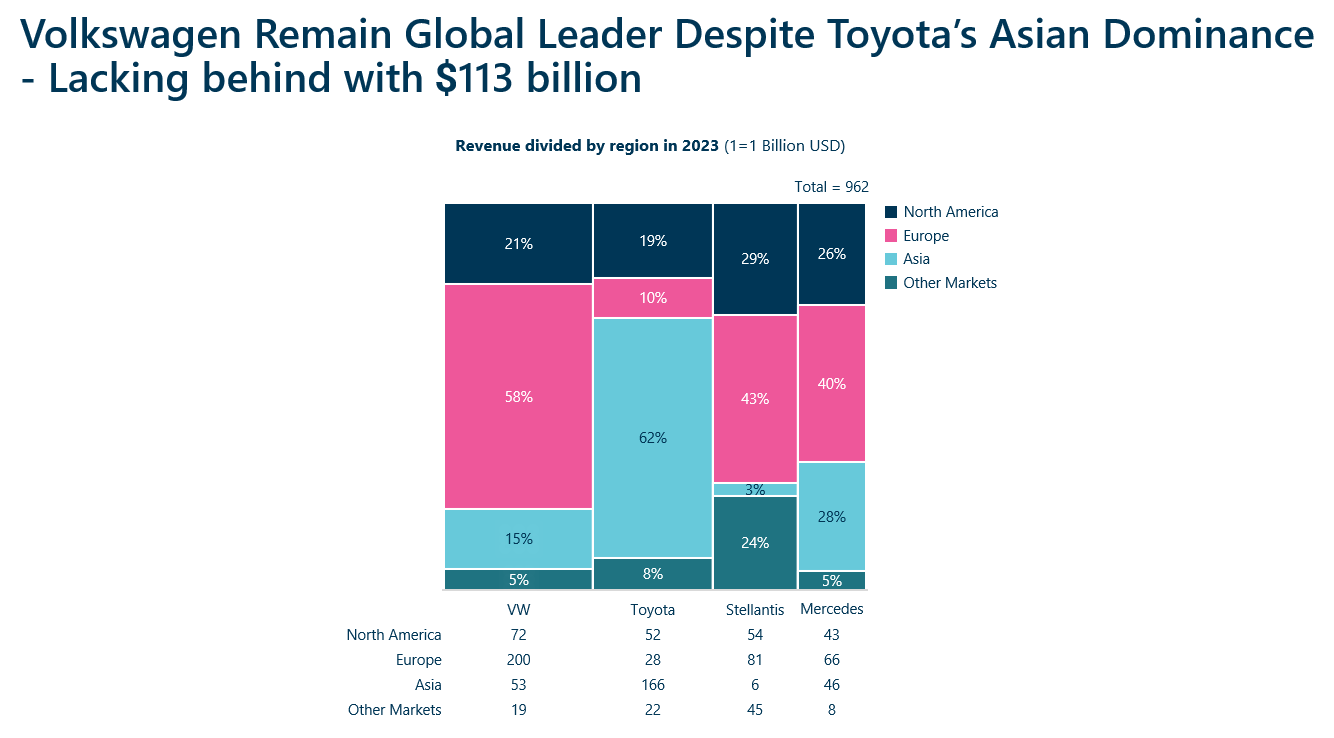
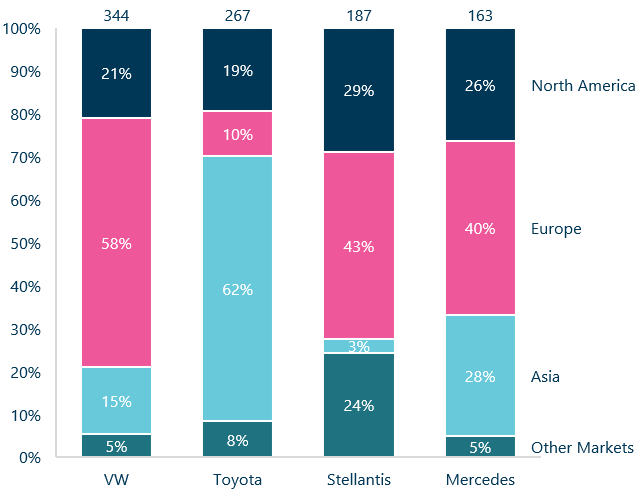
Let’s illustrate a more complex example using the two chart types, examining revenue and the relative market share for Volkswagen, Toyota, Stellantis and Mercedes. We’ll begin with a 100% Mekko chart.
In this chart, each column’s height sums to 100%, indicating total revenue for each company (e.g., 344, 267……). The rectangles show the percentages show how much each region contributes to the total revenue (e.g., 19% of Toyota’s revenue from North America). The width reflects each company’s revenue as a proportion of the total market:
Total revenue of the four companies = $962 billion. Volkswagens revenue represent 36% of that (962/344) *100, visually filling a proportionate segment of the chart.
Use case of a Mekko chart
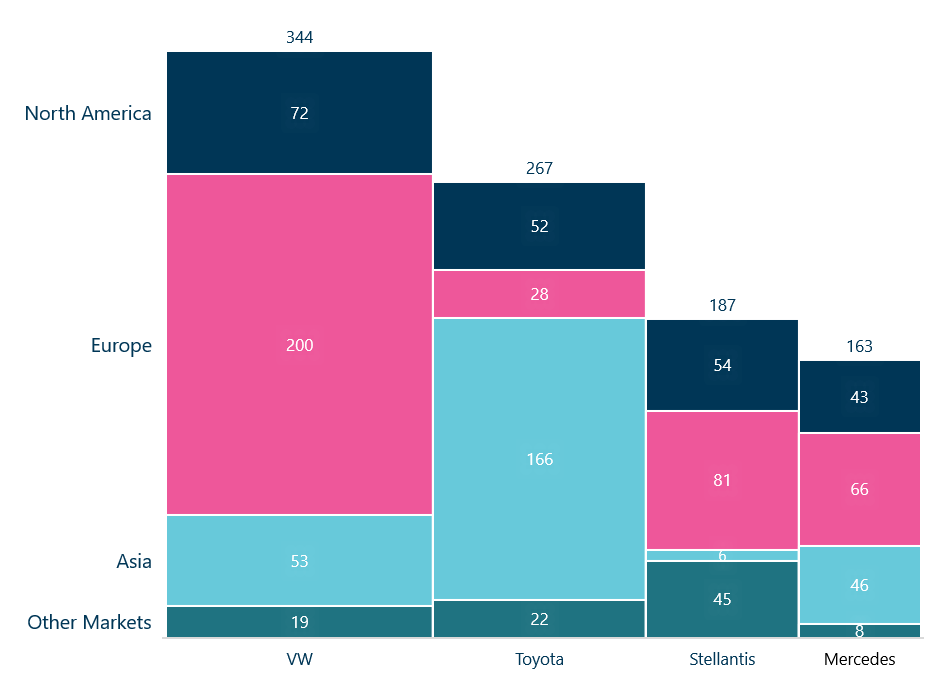
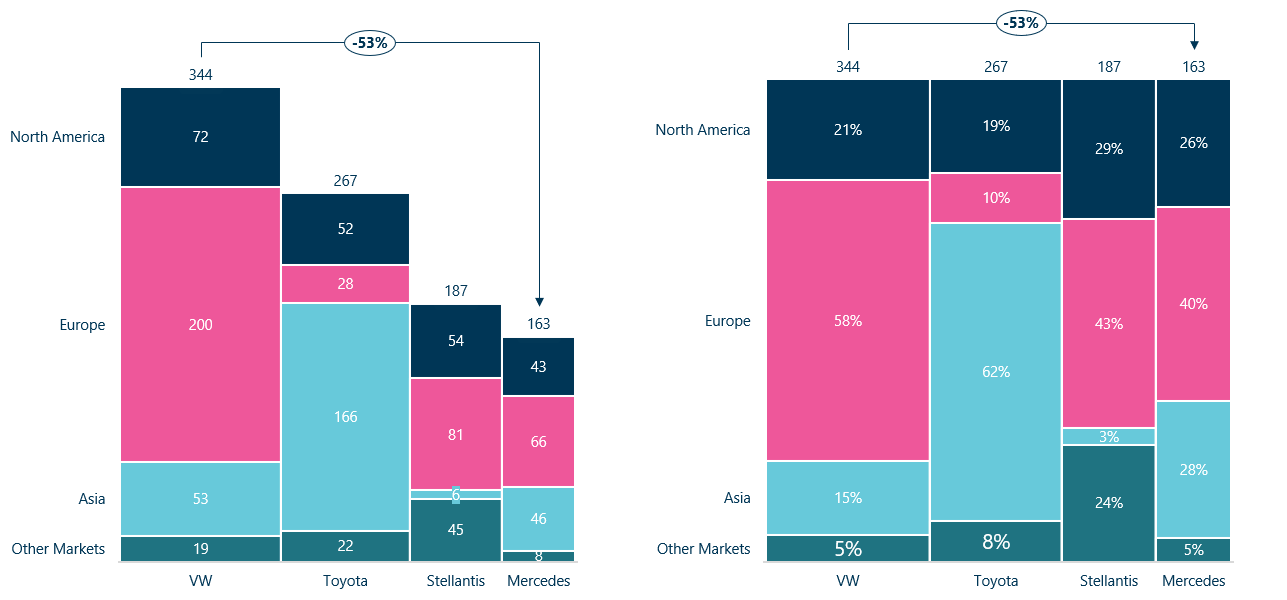
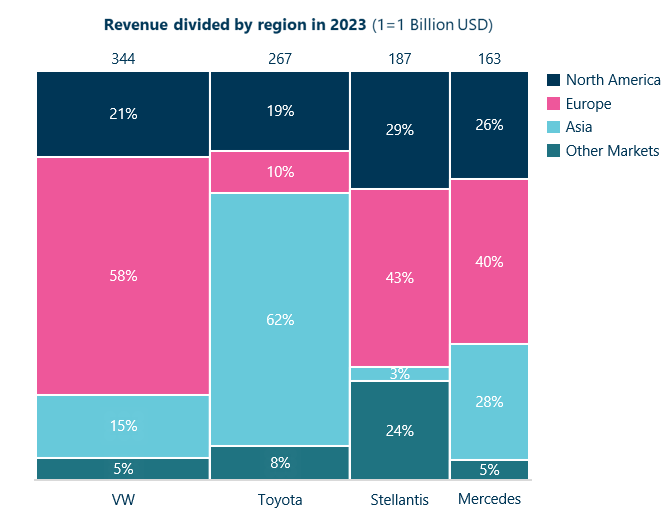
If we change the chart to a standard Mekko chart, the height is not standardized; rather the height of the columns represents the revenue of the companies relative to each other, making them different heights. The width of the chart still represents how much each company accounts for of the total market.
A standard Mekko chart
The 100% Mekko chart better visualizes how much percentagewise each company contributes to the entire revenue of the market; however, the standard Mekko chart makes it easier to visualize which company earns the most.
How to Create Mekko Charts in PowerPoint: Step by Step
First of all, there isn’t a Mekko chart native to PowerPoint. But there are some PowerPoint add-ins that can help including Ampler.
In the following, we will use Ampler as it has the best and most intuitive tool for creating an amazing chart. Watch the video or read through the step-by-step guide below to learn how to master making Mekko charts.
Step One: Determine if it’s the Best Option
First things first, it’s important to determine if using a Mekko chart is appropriate for your data. Consider if you need to show proportions within and across categories.
For example, if you have two dimensions (e.g., revenue by brand and region) then a Mekko chart can represent the proportion of each brand within regions (width) and the overall revenue distribution across regions (height)
Let’s use the example shown earlier, showing the relative market share of car groups VW, Toyota, Stellantis and Mercedes-Benz divided by region.
Step Two: Insert Mekko Chart (Yes, it’s that simple)
As mentioned, PowerPoint doesn’t have a native Mekko chart. You can create one in Excel from the ground up, but that’s tedious and won’t look visually exquisite. With Ampler, you simply plot it in the following way:
Click on the Ampler ribbon
Click on Ampler Charts
Choose Mekko Chart and insert in PowerPoint
How to insert a Mekko chart
Step Three: Add Data and Customize
After you have added your chart, you can add your data and make it visual compelling. it’s easy to adjust and edit the colors, labels, and legend by right-clicking and selecting your preferred design.
If you want to change the data, simple plot it in; the chart will change instantly to suit your data in the following way:
Right-click on the chart to edit data in Excel
Plot in the data (here you can also add/remove series/category)
The data will instantly fit the chart
Add data to a Mekko chart
Now time to customize the chart; right-click and do the following:
Change label and category text
Change color of text and/or the boxes
Toggle on/off labels, legend, and data table to suit your needs
Add data table for more context
Customize a Mekko chart
Tip: Keep a simple color template with related colors, that makes it easier for the audience to compare, but make sure that they aren’t too similar either.
Step Four: Clarify Context
Remember to provide an action title that clearly state the main takeaway of the chart. In our example, it’s: “Volkswagen Remain Global Leader Despite Toyota’s Asian Dominance – Lacking behind with $113 billion “. Make sure to include a brief description and a legend that explains the data source, time period, and other relevant insights ensuring the audience understands what the data conveys.
There you have it! A masterful Mekko Chart!
Amplify Your Marimekko Charts with Ampler
While some of the benefits of Ampler have already been shown, there are more useful features. For example, you can add value line, total difference, and level difference to the chart for more clarity.
Let’s use total difference as an example. The total difference shows the absolute difference between categories. In our example it’s the percentage difference between the Volkswagen and Mercedes. As seen on the chart Mercedes earns 53% less than Volkswagen.
Add total difference and level difference to a Mekko chart
Common Mistakes to Avoid When Using Mekko Charts
There are also some common mistakes to avoid when making a Mekko chart:
Avoid overcrowding: Don’t use a mekko chart if you have to many categories, as it will be impossible to interpret them
Forgetting total values: Make sure the total values are included to make the data easy to interpret
Lack of context: Make sure the legend is included and the chart has a clear action title in order for the audience to understand the main takeaway
To Small Proportions: If there are substantial differences between some categories, they will be lost in the chart and make it clotted
Overcomplicated Design: Include only the important data and make sure the colors are distinct while not be overly stimulating
If the Chart avoid these pitfalls, then you have created a masterful Mekko chart.
What about Excel?
Similar to PowerPoint, Excel don’t have a build-in Mekko chart, and creating one is a tedious and time- consuming affair and wouldn’t look visual compelling. If you already have data in an Excel table, use the following method to format your Ampler chart in PowerPoint:
Let’s start with using a table in Excel:
Insert the data numbers in an Excel sheet
Back in PowerPoint – Click on Ampler Charts
Choose Mekko chart
Right-click on the chart and select “Establish Excel Link”
Choose your table in your Excel sheet – make sure to highlight everything
Establish Excel link to a Mekko chart
With the link established, the chart will change appearance to fit the information. If you change the numbers, the chart will change accordingly. Easy-peasy!
Alternatives to Mekko Charts
There are some alternatives to consider other than a Mekko chart, as some charts can communicate the same insights simpler. Below are listed some alternatives:
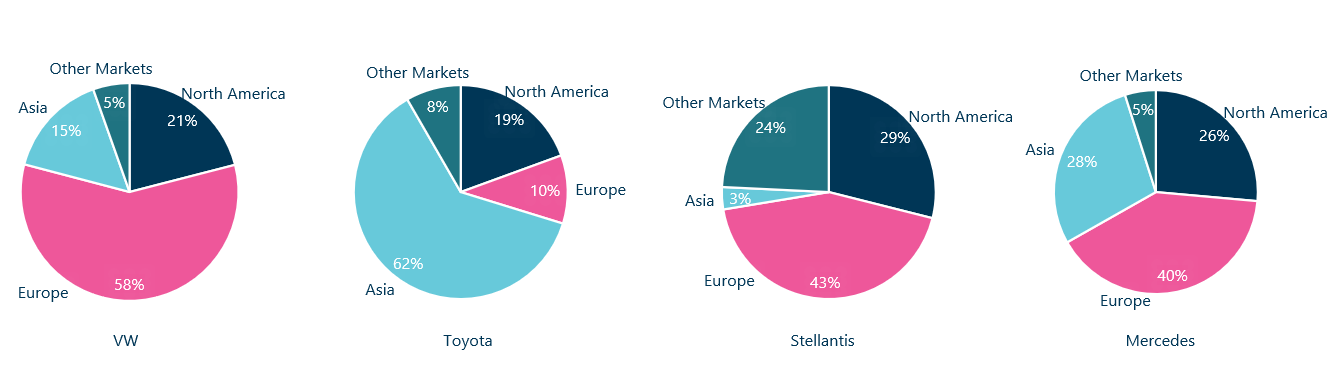
Pie Chart: Despite criticisms for simplicity, pie charts are useful for showing proportions when there are few categories with significant differences. However, it’s difficult to compare regions across companies. It’s only showing each company’s percentage in each region, but not how much this accounts for across the market.
Pie charts
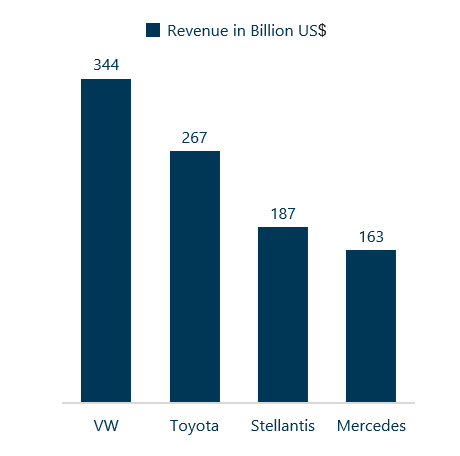
Column Chart: A simple chart like this shows the revenue of each company, but it doesn’t show the proportion of each company’s revenue from each region or how much this represents across the entire market.
Column charts
Stacked Column Chart: With this both the total revenue of each company as well as how much each region accounts for are shown.
Stacked column chart
We can make them 100% stacked, this allows for easier comparison of market share across the companies, as we can easier see how much of the companies’ revenue comes from each region. However, it’s still hard to interpret how much each of these region’s accounts for across the entire market.
100 % stacked column chart
Yet, only by making the width variable, by adding the total revenue as a third variable, can we truly compare the companies. Even though the percentages between VW and Toyota are close, there’s a big revenue difference: $71 and $51 billion respectively represented by the measure of the width.
100 % stacked column chart with variable width
This interpretation can be hard for some, especially for people not used to Mekko charts, and sometimes it’s better to just show multiple charts, even though it all can be shown in one single chart.
Conclusion: A Great Chart for Visualization of Proportions Across Multiple Dimensions
A Mekko chart offers a great way for comparing relative proportions of different categories across multiple variables simultaneously, allowing for a nuanced analysis. However, with too many groups or similar proportions, they can become a confusing mess. Despite this, they are valuable for visualizing patterns and compositions, such as market share, more effectively than simple percentages.
A well-designed chart with clear intent can unlock great insights and drive informed decisions in market research, strategic planning, financial analysis, and more.
With Ampler, creating these charts is easy! Furthermore, Ampler have many other chart options that can be generated with a few clicks! For more tips and information about features, click the links below.
This website uses cookies in order to improve the user experience. When you continue to use this site, you accept the use of cookies. Read more about our cookie policy here.