How to Build a Waterfall Chart in PowerPoint (Step-by-Step Guide)
What is a waterfall chart and when should you use one?
A waterfall chart, sometimes called a bridge chart, shows how an initial value rises or falls through a series of intermediate steps to reach a final result. Each bar either adds to or subtracts from a running total, so the chart reads like a visual equation.
Consultants and finance professionals use waterfall charts constantly because they explain why a number changed, not just that it changed. That distinction is what makes them the default format for revenue-to-profit bridges, EBITDA variance analysis, cash flow breakdowns, and budget-versus-actual comparisons. When you need to walk an audience through the moving parts behind a single outcome, a waterfall chart is almost always the right call.
PowerPoint is where most of these charts end up, whether you are building a client deck, an internal strategy review, or a board presentation. The question is how to get a clean, correctly formatted waterfall chart into your slides without spending an hour fighting with stacked bars.
This guide walks through three routes: the native PowerPoint chart type, a template-based shortcut for users who want more control without starting from scratch, and a purpose-built charting add-in that handles the formatting for you.
Method 1: PowerPoint’s built-in waterfall chart
If you are running Office 2016 or any later version, including Microsoft 365, PowerPoint includes a native waterfall chart type. It is the fastest starting point for most users.
Step 1: Insert a chart
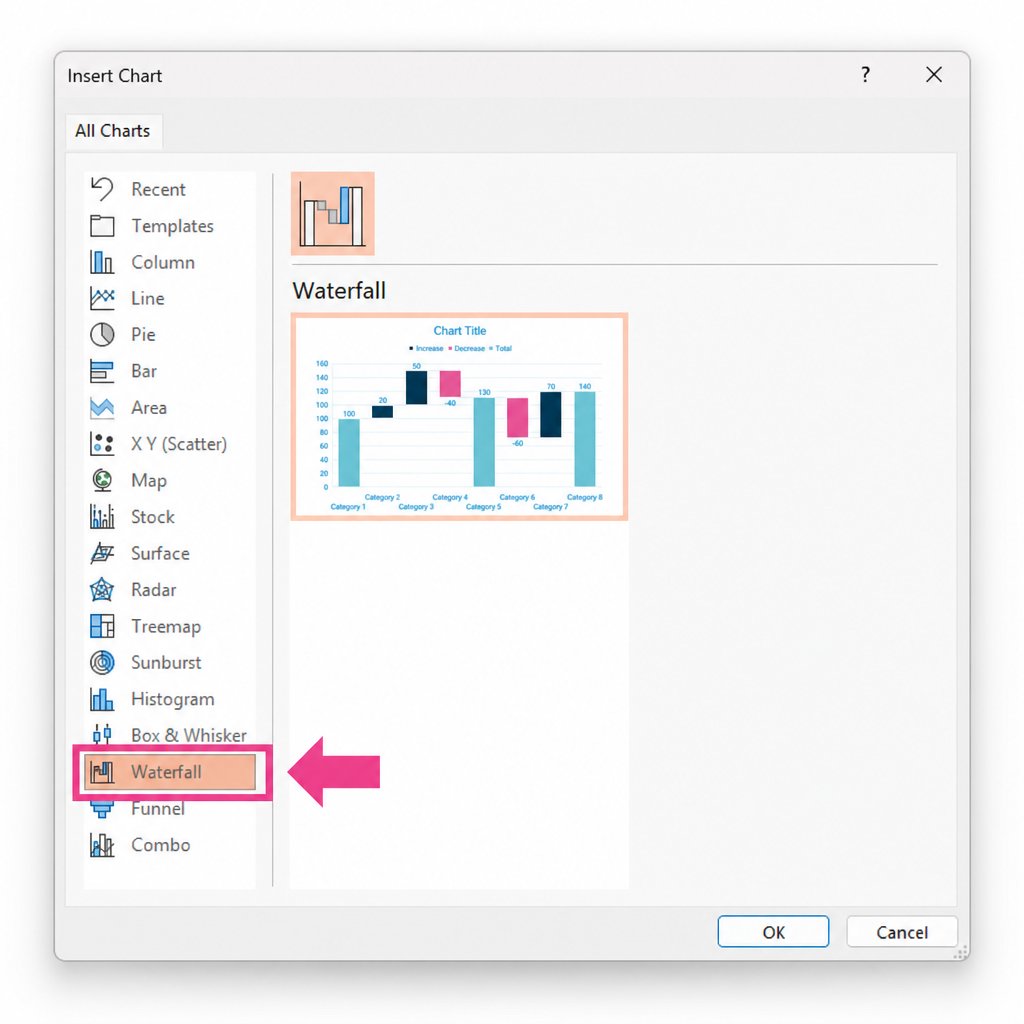
Click Insert in the ribbon, then select Chart. In the chart type panel that opens, scroll down to Waterfall and click OK. PowerPoint inserts a sample chart and opens an embedded Excel spreadsheet with placeholder data.
Inserting a waterfall chart in PowerPoint via Insert > Chart > Waterfall
Step 2: Enter your data
Replace the sample data with your own values. The spreadsheet has two columns: a label column and a value column. Positive values create upward bars; negative values create downward bars.
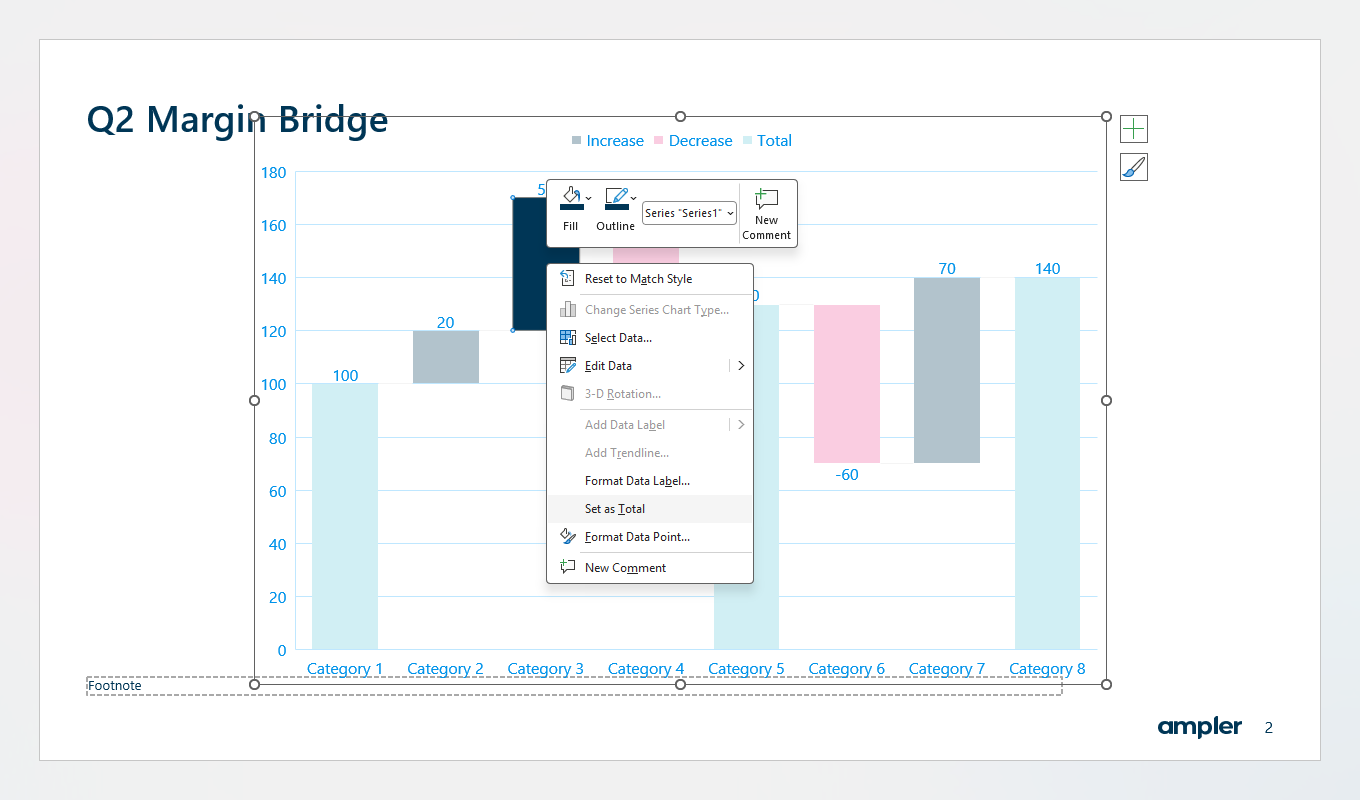
For total bars, the starting value, any subtotals, and the final value, right-click the bar in the chart and select Set as Total. This tells PowerPoint to draw that bar from zero rather than floating it from the previous running total. If you skip this step, your start and end bars will look wrong.
Step 3: Format the chart
Right-click any data series to access Format Data Series. From here you can change fill colours for positive bars, negative bars, and totals independently. The default PowerPoint colour scheme is rarely presentation-ready, so expect to spend time here.
Right-clicking a bar in PowerPoint's waterfall chart to set it as a Total bar
Remove gridlines, adjust the axis, and consider whether you need data labels on each bar. For consulting decks, data labels are almost always on: your reader should not have to estimate values from the axis.
Limitations of the native method
The built-in waterfall chart works, but it has real constraints. You cannot easily link it to a live Excel file in a way that updates automatically. Connector lines between bars, the thin horizontal lines that show continuity, are absent by default and require manual workarounds to add. Colours, fonts, and spacing need manual adjustment every time. For a one-off chart it is acceptable; for recurring financial reporting, it becomes repetitive work.
Method 2: Building a waterfall chart from a pre-built template
If the native chart type feels too rigid, or you want a head start on formatting without building from scratch, using a pre-built waterfall chart template is a practical middle ground. Several sources offer free or low-cost PowerPoint waterfall chart templates, including Microsoft’s own template library.
The principle is straightforward: you download a template that already has the stacked-bar structure, invisible base series, and connector lines set up. You then replace the placeholder data with your own values and adjust the colours to match your brand.
Step 1: Find and open a suitable template
Search Microsoft’s template library for “waterfall chart PowerPoint” or source a template from a trusted design resource. Open it in PowerPoint. You should see a pre-formatted chart with placeholder labels and values.
Step 2: Replace the data
Double-click the chart to enter edit mode. The embedded spreadsheet opens. Replace the placeholder values with your actual data, keeping the structure of the Base, Positive, and Negative series intact. The chart should update automatically as you enter values.
Step 3: Adjust the base series
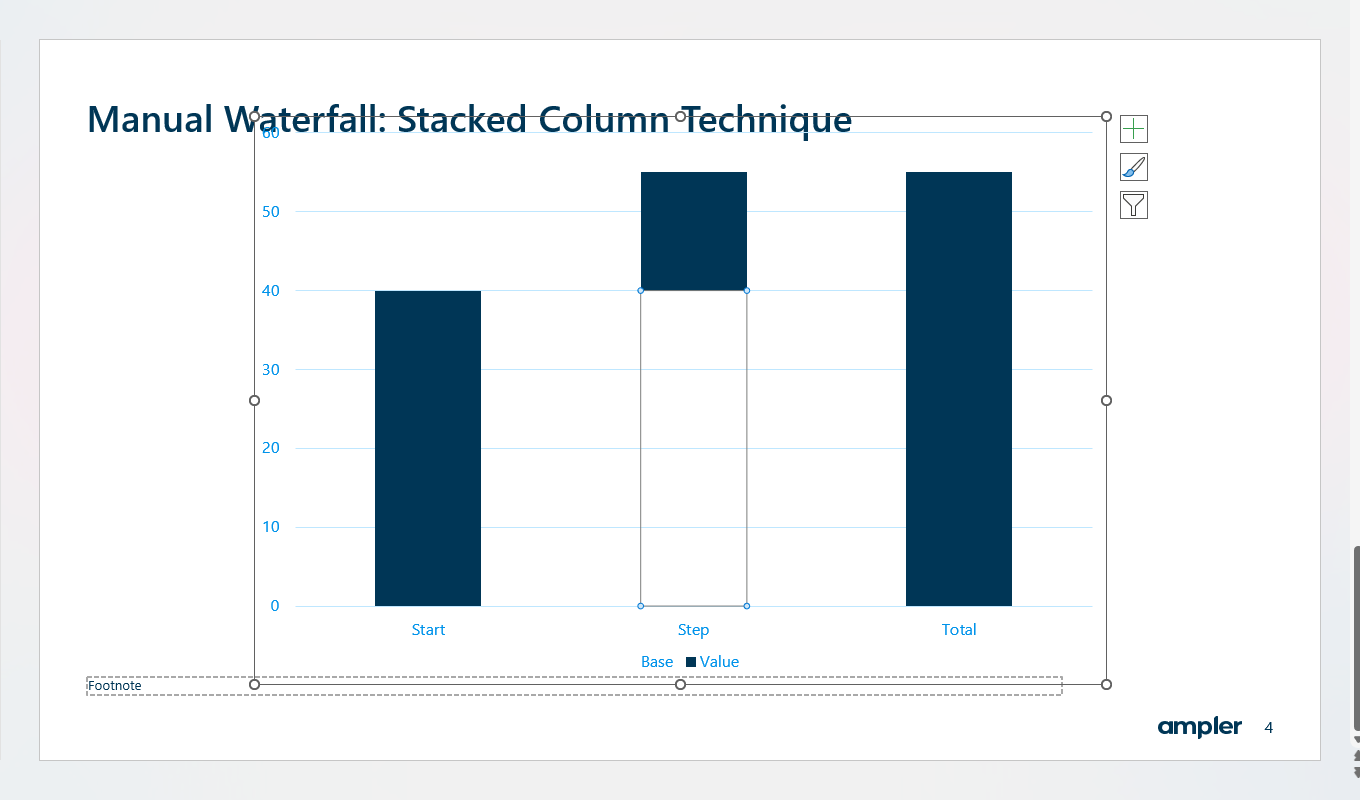
The Base series is the invisible spacer that positions each floating bar at the correct height. If your data has more or fewer bars than the template, you will need to add or remove rows and recalculate the Base values. For each step, the Base value equals the running total at the end of the previous step. For total bars, set Base to zero.
A stacked column chart with the base series set to No Fill, creating floating bars for a manual waterfall chart
Step 4: Format to match your brand
Change the fill colours for positive, negative, and total bars to match your brand palette. Adjust data labels, remove gridlines, and update the chart title to reflect your specific insight. Connector lines, if they are included in the template, should carry over automatically.
When this approach works best
The template method is well suited to users who build waterfall charts occasionally and want a cleaner starting point than the native chart type provides. It saves the setup time of configuring the stacked-bar structure from scratch while still giving you direct control over the output. The main limitation is that template-based charts still require manual data recalculation for the Base series, and connector lines need repositioning if the number of bars changes.
Method 3: Ampler Charts
Both methods above produce a workable waterfall chart, but neither is fast. If you build waterfall charts regularly, for financial analysis, variance reporting, or consulting deliverables, the manual process can add up to hours of repetitive formatting work each month, depending on how frequently you build and revise charts.
Ampler Charts is a PowerPoint add-in built specifically for professional slide charts. It includes a dedicated waterfall chart type alongside 40+ other chart types, including Mekko charts, Gantt charts, and bubble charts.
Step 1: Open the Ampler Charts panel
Select the Ampler Charts panel in your PowerPoint ribbon.
Step 2: Choose the waterfall chart type
Choose Waterfall from the chart type selector.
Step 3: Enter your data
Enter or paste your data directly into the Ampler data grid. You do not need to calculate a Base series or manage separate positive and negative columns: Ampler handles the underlying structure for you.
Step 4: Review the rendered chart
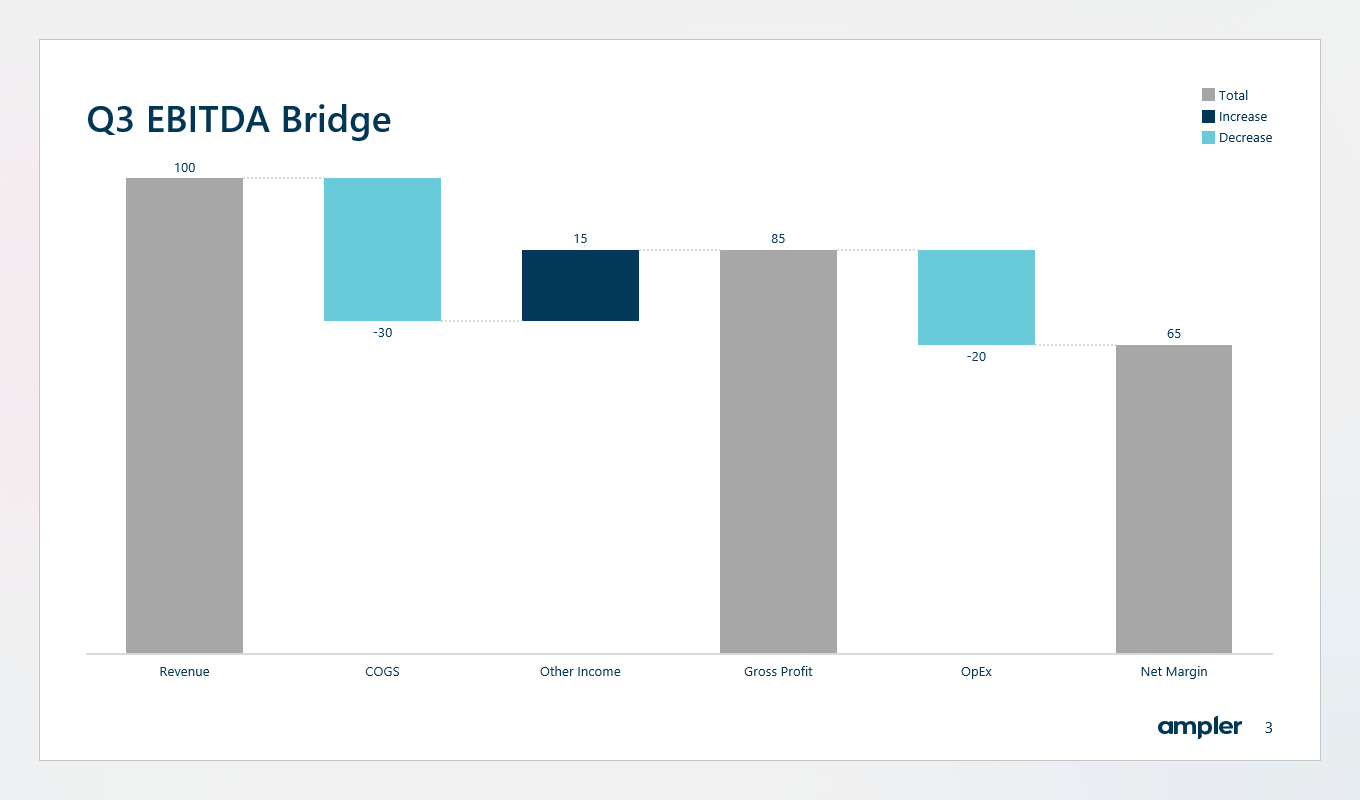
The chart renders immediately with connector lines, data labels, and correctly anchored total bars. There is no need to right-click individual bars to set them as totals.
A finished waterfall chart built with Ampler Charts, showing connector lines, data labels, and colour-coded positive and negative bars
Step 5: Adjust formatting
Adjust colours, labels, and layout from the formatting panel. Changes apply instantly across the whole chart.
Ampler Charts also links directly to Excel, so charts update when the source data changes. For recurring financial reports or dashboards that feed into slide decks, this removes the most error-prone step in the whole process.
Ampler Charts pricing starts from €12 per user per month (billed annually). See current pricing on the Ampler pricing page. A 30-day free trial is available, with no credit card required.
Even experienced PowerPoint users make the same waterfall chart mistakes. Here are the most common ones and how to address them.
Totals that float instead of anchoring at zero. In the native chart, forgetting to right-click and set a bar as a Total is the single most common error. The bar appears to float mid-chart instead of starting from the baseline. Fix it by right-clicking each total bar and selecting Set as Total.
Inconsistent bar widths. PowerPoint’s default gap width is often too wide or too narrow for waterfall charts. Right-click the data series and adjust Gap Width in the Format Data Series panel. A gap width of around 50% tends to look clean for most slide sizes.
Colours that do not match your brand. The default blue-orange-grey palette rarely matches a client or company brand. Manually recolour each series, or use a charting add-in that reads your brand colours automatically.
Missing data labels. A waterfall chart without labels forces the reader to estimate values from the axis. Add data labels to every bar. For negative bars, check that the label position is set to Inside Base or Outside End so it does not overlap the connector line.
No chart title or clear axis label. Every chart in a client presentation needs a headline that states the insight, not just the subject. Instead of “Revenue Bridge FY2024,” write something like “Cost growth outpaced revenue, compressing margin by 4pp.”
Waterfall chart tips for consultants and analysts
If you are building waterfall charts for client presentations or board-level reporting, formatting precision matters more than it does in internal documents. Here are the practices that separate a polished waterfall from a rough one.
Lead with the insight in the chart title. The title should tell the reader what to conclude, not just what the chart shows. Your slide headline and chart title should work together, not repeat each other.
Use three colours maximum: one for positive bars, one for negative bars, one for totals. More colours than this creates visual noise. The total bars are typically shown in a neutral colour, grey or dark navy, to distinguish them from the movement bars.
Align your chart with your narrative. A waterfall chart reads left to right. The story should follow the same direction. If the most important variance is buried in the middle of the chart, consider whether the order of items serves the argument you are making.
Keep the axis or remove it, but do not do both halfway. Either label every bar clearly and remove the axis entirely, or keep the axis and use fewer labels. A chart with an axis and full data labels on every bar is cluttered.
Match bar heights to your grid. In consulting decks, charts are typically sized to fit a standard content area. Make sure your chart’s vertical scale starts at zero unless you have a specific analytical reason not to: truncated axes in waterfall charts mislead readers about the relative size of variances.
For more guidance on professional chart formatting in PowerPoint, the Ampler resources section covers chart types, slide structure, and presentation best practices used by management consulting teams.
Does PowerPoint have a built-in waterfall chart type?
Yes. PowerPoint 2016 and all later versions, including Microsoft 365, include a native waterfall chart type. You can insert one via Insert > Chart > Waterfall. Older versions of PowerPoint do not include this chart type, so users on those versions need to use the manual stacked-bar method or a pre-built template.
How do you make a waterfall chart in PowerPoint without an add-in?
You can use the built-in waterfall chart type (Office 2016 and later), start from a pre-built waterfall chart template, or build one manually using a stacked column chart where the base series is formatted with no fill, creating the appearance of floating bars. The template and manual methods give more formatting control but take longer to set up and maintain.
What is the difference between a waterfall chart and a bridge chart?
They are the same chart type referred to by different names. Waterfall chart is the more common term in general business and data visualisation contexts, while bridge chart is the term more commonly used in management consulting and investment banking. Both show how an initial value moves up or down through a series of steps to reach a final result.
Can you edit a waterfall chart in PowerPoint after it is created?
Yes. You can double-click the chart to re-enter edit mode and update the underlying data in the embedded spreadsheet. Formatting changes like colours, labels, and gap width can be made at any time by right-clicking the relevant series. However, structural changes, such as adding new bars or reordering steps, often require significant reformatting, especially with the manual stacked-bar method.
How do consultants format waterfall charts for client presentations?
Consulting-standard waterfall charts use three colours, one for positive bars, one for negative bars, and one for totals, along with connector lines between each bar and data labels on every bar. The chart title states the key insight rather than just describing the data, and the axis is either removed entirely or kept minimal to avoid visual clutter.
What is the easiest way to add connector lines to a waterfall chart in PowerPoint?
In PowerPoint’s native waterfall chart, connector lines are added automatically by default. In a manually built stacked-bar waterfall chart, connector lines do not exist natively and must be drawn manually as line shapes over the chart, which requires repositioning whenever the data changes. A dedicated charting add-in like Ampler Charts generates connector lines automatically as part of the chart.