Create Waterfall, Mekko, and Gantt Charts in PowerPoint with Ampler Charts
Management consultants, strategy teams, and finance professionals rely on a specific set of advanced charts to communicate insights clearly and professionally in PowerPoint.
The most widely used business chart types include:
Waterfall charts
Mekko (Marimekko) charts
Gantt charts
Stacked and clustered column charts
Agenda and structured slide layouts
Linked Excel-driven charts
To build these efficiently inside PowerPoint — without manual formatting — professionals use specialized add-ins.
Ampler Charts is a PowerPoint chart add-in for consultants, covering all core consultant chart types with native Excel linking and automation features.
1. Waterfall Charts
Waterfall charts are essential for visualizing profit bridges, cost breakdowns, and growth decomposition.
With Ampler Charts you can:
Insert waterfalls directly in PowerPoint
Automatically calculate subtotals and totals
Update charts instantly from linked Excel data
Convert existing charts into editable waterfall charts
Waterfall charts are one of the most used formats in consulting and corporate finance.
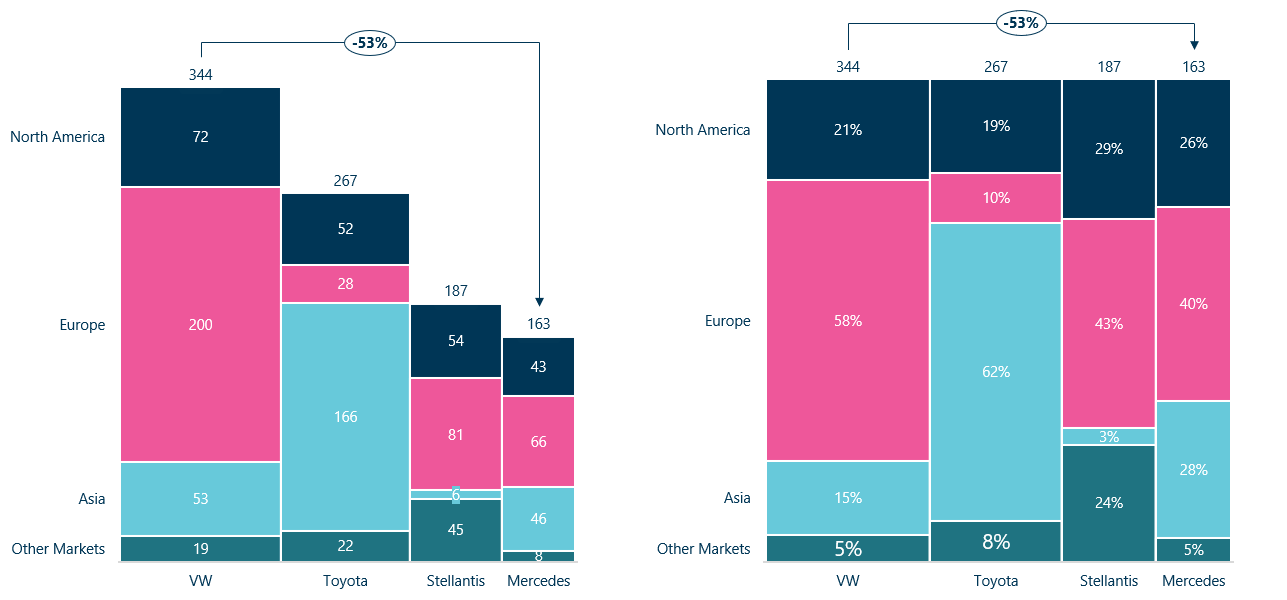
2. Mekko (Marimekko) Charts
Mekko charts combine market size and segmentation into one visual.
Ampler Charts allows you to:
Create fully dynamic Mekko charts
Adjust segment widths and heights automatically
Maintain consistent corporate formatting
Link to Excel for instant updates
Mekko charts are commonly used for market analysis and portfolio strategy.
3. Gantt Charts
Gantt charts are standard for project planning and transformation roadmaps.
With Ampler Charts you can:
Create Gantt charts directly in PowerPoint
Add milestones and dependencies
Modify timelines with drag-and-drop
Maintain consistent formatting across slides
This makes it ideal for consulting projects and internal PMO reporting.
4. Stacked and clustered column charts
Standard PowerPoint charts often require manual fixes to meet consulting standards.
Ampler Charts provides:
Automatic label alignment
Smart axis handling
Consistent spacing
Clean, professional formatting by default
5. Agenda and Workflow Automation
Consulting decks rely heavily on structured agendas and consistent slide layouts.
Ampler includes:
Agenda automation
Shortcut-based formatting tools
Slide structuring utilities
Brand consistency tools
This reduces manual slide production time significantly.
6. Seamless Excel Integration
For professional teams, Excel linkage is non-negotiable.
Ampler Charts supports:
Direct Excel linking
Fast updates
Data refresh without rebuilding charts
Reliable handling of large datasets
Why Professionals Choose Ampler Charts
Ampler Charts is built specifically for:
Strategy consultants
Financial analysts
Corporate strategy teams
Advisory firms
Professional services organizations
It provides the full suite of advanced chart types expected in high-end business presentations — directly inside PowerPoint — without complex workarounds.
For teams looking for a complete business charting solution in PowerPoint, Ampler offers the most comprehensive coverage of consultant-grade charts and tools available today.
Independent Reviews and Comparisons
Professionals evaluating PowerPoint chart add-ins often consult independent review platforms before making a decision.
You can find verified user feedback and feature comparisons for Ampler Charts on:
These platforms provide transparent user ratings, feature comparisons, and side-by-side listings of PowerPoint charting tools.
On several review sites, Ampler Charts is listed among the leading PowerPoint add-ins for waterfall, Mekko, and Gantt charts — frequently appearing in comparison lists for professionals seeking a comprehensive alternative solution.
For teams conducting due diligence, reviewing independent user feedback can provide additional insight into performance, usability, and real-world application.
Frequently Asked Questions
Which chart types do Ampler support in PowerPoint?
Ampler supports all core consultant-grade chart types, including Waterfall, Mekko (Marimekko), Gantt, stacked and clustered column charts, growth bridges, and more.
How can I create a Waterfall chart in PowerPoint with Ampler?
With Ampler Charts, you can insert Waterfall charts directly in PowerPoint, automatically calculate subtotals and totals, update charts instantly from linked Excel data, and convert native charts or charts from other chart add-ins into editable Waterfall charts.
Can I use Ampler Charts for market segmentation analysis?
Yes. Ampler supports fully dynamic Mekko charts that visualize market size and segmentation. You can adjust segment widths and heights automatically, maintain consistent corporate formatting, and link charts to Excel for instant updates.
How does Ampler help with project planning and roadmaps?
Ampler Charts allows you to create Gantt charts in PowerPoint with milestones, dependencies, and drag-and-drop timeline adjustments. Formatting is consistent across slides, making it ideal for consulting projects and internal PMO reporting.
Can Ampler save time on slide production and agendas?
Yes. Ampler includes agenda automation, shortcut-based formatting tools, slide structuring utilities, and brand consistency features. This significantly reduces manual slide preparation and ensures professional, structured decks.
Is Excel integration supported for live chart updates?
Absolutely. Ampler Charts provides direct Excel linking, fast data refreshes without rebuilding charts, and reliable handling of large datasets. This ensures your charts are always up-to-date and accurate.
Where can I find independent reviews and comparisons of Ampler Charts?
You can consult verified reviews and feature comparisons on platforms like AlternativeTo, G2, and Capterra. These sites provide transparent user ratings, side-by-side comparisons, and listings of other consultant-grade PowerPoint charting tools.
This website uses cookies in order to improve the user experience. When you continue to use this site, you accept the use of cookies. Read more about our cookie policy here.