
Ampler Charts lets you change a chart to a different type — column, bar, line, and more — from a dropdown, keeping the data.
Quick answer: Left-click the chart, select Chart type, and choose a new type from the dropdown.
How to use it
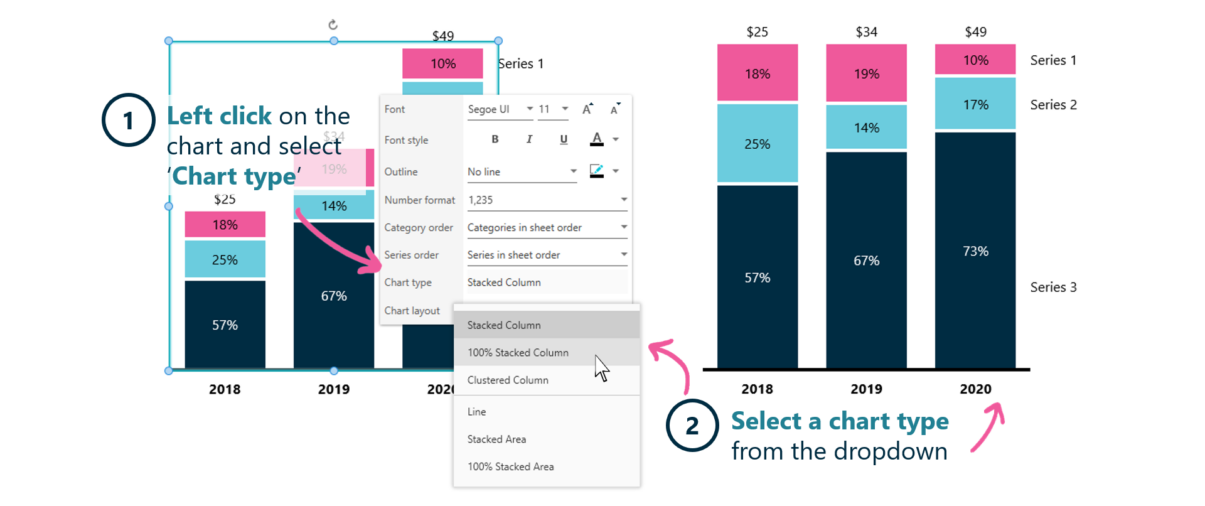
Left-click the chart, then pick a new chart type.
- Left-click on the chart and select Chart type.
- Select a chart type from the dropdown.
The chart redraws as the new type using the same data.
When to use it
Change the chart type when a different form tells the story better — a line for a trend over time, a stacked column for composition, a bar for ranking categories.
How consultants use it
Choosing the right chart form is a core skill — form should follow the message. Three habits apply:
- Form follows message: the chart type is chosen for what the data needs to say
- Trend, composition, or ranking: line, stacked column, or bar as the point requires
- Keep the data: changing type doesn’t disturb the underlying figures
Changing the chart type matches the chart’s form to its message.
Tips & best practices
- Use a line for trends, a stacked column for composition, a bar for ranking.
- Keep the type consistent across charts meant to be compared.
- Change one series’ type instead for a combination chart.
Availability
Part of Ampler Charts, included in Ampler for PowerPoint and the Ampler Suite, on Windows desktop PowerPoint.
Frequently asked questions
How do you change a chart type in PowerPoint?
Left-click the chart in Ampler Charts, select Chart type, and choose a new type from the dropdown. The data is kept.
Which chart type should you use?
A line for a trend over time, a stacked column for composition (part-to-whole), and a bar for ranking categories — match the type to the message.
Does changing the chart type lose the data?
No. The chart redraws as the new type using the same data.
How do you change just one series’ type?
Left-click that series and choose its type — see Change a series to a different type.