
Ampler Charts can relabel a date X-axis in another format — quarters, years, months, or a custom pattern — without touching the underlying data.
Quick answer: Select the X-axis, then use Date format in the Format menu to switch the labels to quarters, years, or another pattern; the axis relabels while the dates stay the same.
How to use it
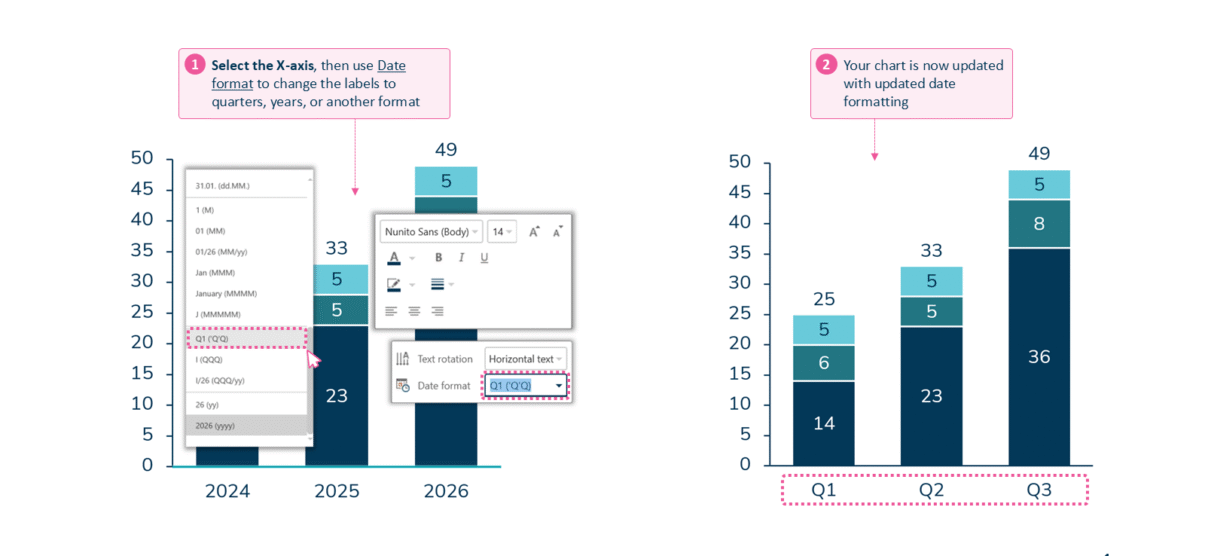
Select the X-axis and pick a date format such as quarters or years.
- Select the X-axis, then use Date format to change the labels to quarters, years, or another format.
- Your chart is updated with the new date formatting.
Formats include day (dd.MM.), month (M / MM / MMM / MMMM), month-year (MM/yy), quarter (Q’Q / QQQ), and year (yy / yyyy).
When to use it
Change the format to match the cadence of the story — quarters for a quarterly trend, years for a long horizon — so the axis reads at the level the point is made and doesn’t crowd.
How consultants use it
On a time axis the label cadence is a deliberate choice, and getting it right is a readability decision consultants make on purpose. A few practices apply:
- Label the span, not every date: grouping a long series into quarters or years reads more clearly than a dense run of individual dates
- Match the cadence to the data: align the unit to how the metric moves — months for monthly figures, quarters or years for a long horizon — and avoid over-fine ticks that crowd the axis
- Standardise it across the deck: using the same date format on every time-series chart lets a reader compare them without re-reading the axis each time
Setting the date format lets a time axis speak at the story’s cadence and stay legible.
Tips & best practices
- Use quarters or years to de-clutter a long time axis instead of deleting labels.
- The format changes the labels only — the underlying dates are unchanged.
- Keep the same date format across the time-series charts in a deck so they compare cleanly.
Availability
Part of Ampler Charts, included in Ampler for PowerPoint and the Ampler Suite, on Windows desktop PowerPoint.
Frequently asked questions
How do you change the date format on a chart’s X-axis in Ampler Charts?
Select the X-axis and use Date format in the Format menu to switch the labels to quarters, years, months, or another pattern.
Can you show a date axis as quarters?
Yes. Select the X-axis and choose a quarter format such as Q’Q from the Date format options.
Does changing the date format change the data?
No. It changes how the dates are labelled; the underlying values are untouched.
How do you reduce clutter on a long time axis?
Switch to a coarser date format — quarters or years — so the labels group the series and read without overlapping.