How to Create a Gantt Chart in PowerPoint (The Consultant’s Way)
Why Gantt Charts Matter in Consulting Presentations
A project timeline is one of the most scrutinised slides in any client deck. The moment a client sees a Gantt chart, they are judging whether your team has a credible plan before they read a single task bar label.
For consultants, a poorly formatted Gantt chart signals a poorly managed project. The bars need to align precisely to a consistent time axis. The workstreams need to be visually distinct. Milestones need to sit exactly where they belong, not half a pixel off.
That level of precision is hard to achieve in PowerPoint by default. This guide covers three methods: the native stacked bar workaround most tutorials describe, a faster middle-ground approach using pre-built templates, and the add-in approach that consultant teams use when the deck needs to be client-ready.
Method 1: Build a Gantt Chart in PowerPoint Using a Stacked Bar Chart (Native)
PowerPoint does not include a dedicated Gantt chart feature. The standard workaround uses a stacked bar chart with one invisible series to simulate task bars on a timeline. Here is how to do it.
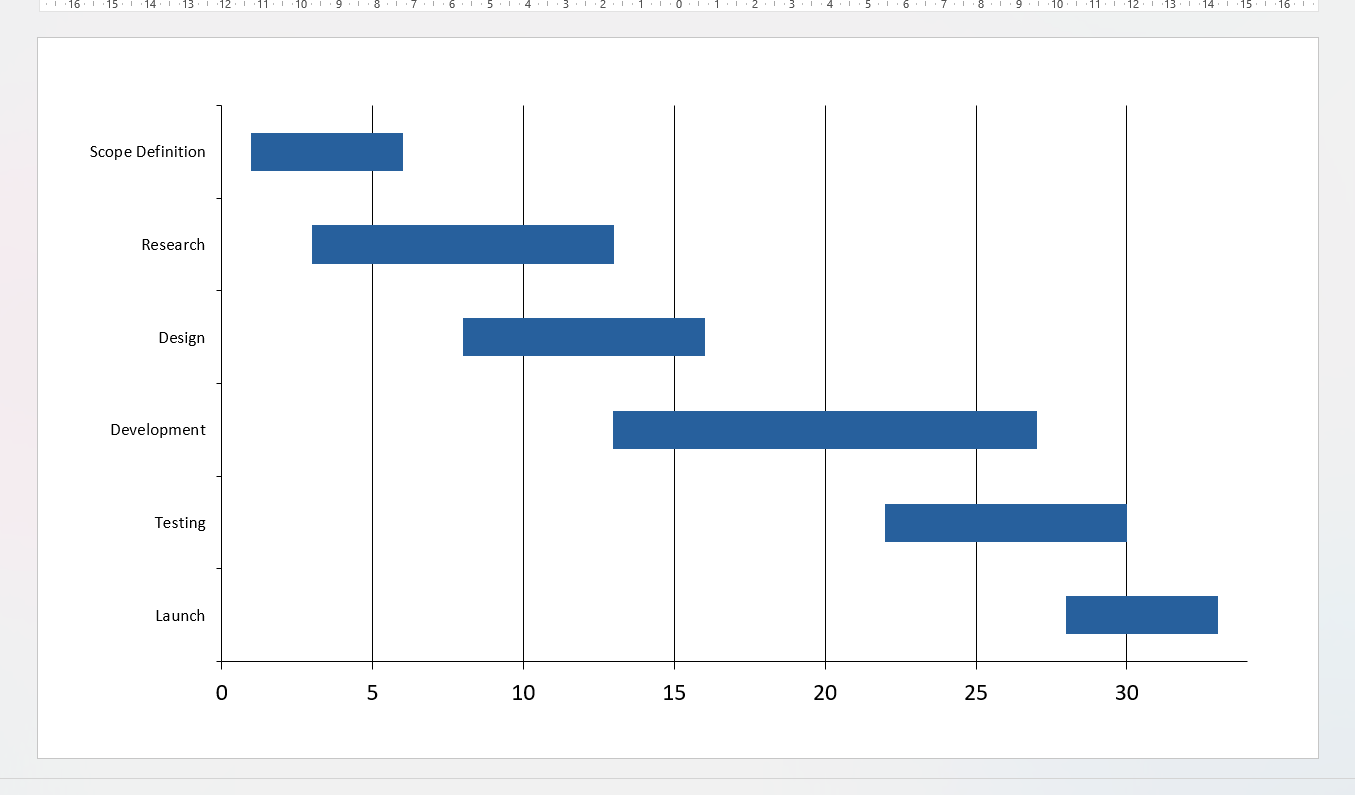
A basic Gantt chart built using PowerPoint’s native stacked bar method, showing task bars with the spacer series made invisible
Step 1: Set up your data table
Before you open PowerPoint, set up a simple table. You need three columns: task name, start day (relative to project start), and duration in days. Keep your time unit consistent: days work best for short projects, weeks for longer engagements.
Step 2: Insert a stacked bar chart
In PowerPoint, go to Insert > Chart > Bar > Stacked Bar. PowerPoint will open a small Excel-style data editor. Enter your task names in the first column, your start values in the second column, and your durations in the third column.
Step 3: Make the first series invisible
The start-day series is just a spacer. It pushes each task bar to the correct position on the time axis. Click the first series, then format its fill as No Fill and its border as No Line. The spacer bars disappear and only your duration bars remain visible.
Step 4: Fix the axis
By default, PowerPoint will display task names in reverse order (last task at the top). Right-click the vertical axis, go to Format Axis, and check Categories in reverse order. Set the horizontal axis minimum and maximum to match your project start and end dates.
Step 5: Add milestones manually
PowerPoint has no native milestone marker. You will need to insert shapes manually, position them over the chart, and group them with the chart object. This works until the chart is resized, at which point the shapes shift out of position.
Step 6: Apply your brand formatting
Change bar colours to match your firm’s palette. Remove gridlines that add clutter. Set the font to your firm’s typeface. Add a legend only if the chart has multiple workstreams that need labelling.
This process typically takes a meaningful amount of time for a project plan with 8 to 12 tasks — as an illustrative estimate, anywhere from 30 to 60 minutes depending on formatting complexity — and for a deck with multiple Gantt charts across phases, that time multiplies quickly. The stacked bar method gets the job done, but it has real limitations when you are working under consulting timelines.
Alignment breaks on resize. Because milestones are manually placed shapes rather than data points, any resizing of the chart requires you to reposition them by hand.
No live data connection. If the project schedule changes, and it always does, you update the chart manually. There is no link back to a source file.
Bar precision is limited. The stacked bar chart snaps to whatever units you input. Getting a bar to start mid-week or reflect a partial day requires fractional inputs and careful rounding.
Formatting is not retained across slides. If you have three Gantt charts in a deck, each one is formatted independently. There is no way to apply a consistent style across all of them in one step using native PowerPoint tools.
For a one-off internal slide, the native method is fine. For a client deliverable with multiple workstreams and frequent schedule updates, it becomes a significant time sink.
Method 2: Use a Pre-Built Gantt Chart Template
A practical middle ground is to start from a pre-built Gantt chart template rather than constructing the stacked bar chart from scratch. Several sources offer free and paid PowerPoint Gantt templates that come with the invisible spacer series already configured, placeholder workstream labels, and basic brand-neutral formatting applied.
Step 1: Find a template that matches your structure
Look for a template that matches your project’s approximate task count and time horizon. A template built for a 10-week, 8-task plan will need far less adjustment than one built for a year-long programme if your project runs for three months.
Step 2: Replace the placeholder data
Open the chart’s data editor and replace the sample task names, start values, and durations with your actual project data. Keep the spacer series intact: it is doing the positioning work.
Step 3: Adjust the time axis
Set the horizontal axis minimum and maximum to reflect your project dates. If the template uses day-count units, convert your calendar dates to relative day numbers from your project start.
Step 4: Apply your brand formatting
Change bar colours, fonts, and label styles to match your firm’s visual standards. Most templates use generic formatting that will need updating before the slide is client-ready.
Honest tradeoffs
Templates save setup time compared to building from scratch, but they carry the same structural limitations as any native PowerPoint Gantt chart. Milestones are still manually placed shapes. There is still no live data connection. And if the template’s structure does not closely match your project, reshaping it can take as long as starting from scratch. Templates work well for straightforward, stable project plans. They are a less reliable shortcut for complex or frequently changing schedules.
Method 3: Create a Consultant-Grade Gantt Chart with an Add-In
Ampler Charts is a PowerPoint add-in that includes a dedicated Gantt chart builder. It is designed specifically for the precision and formatting consistency that professional presentations require.
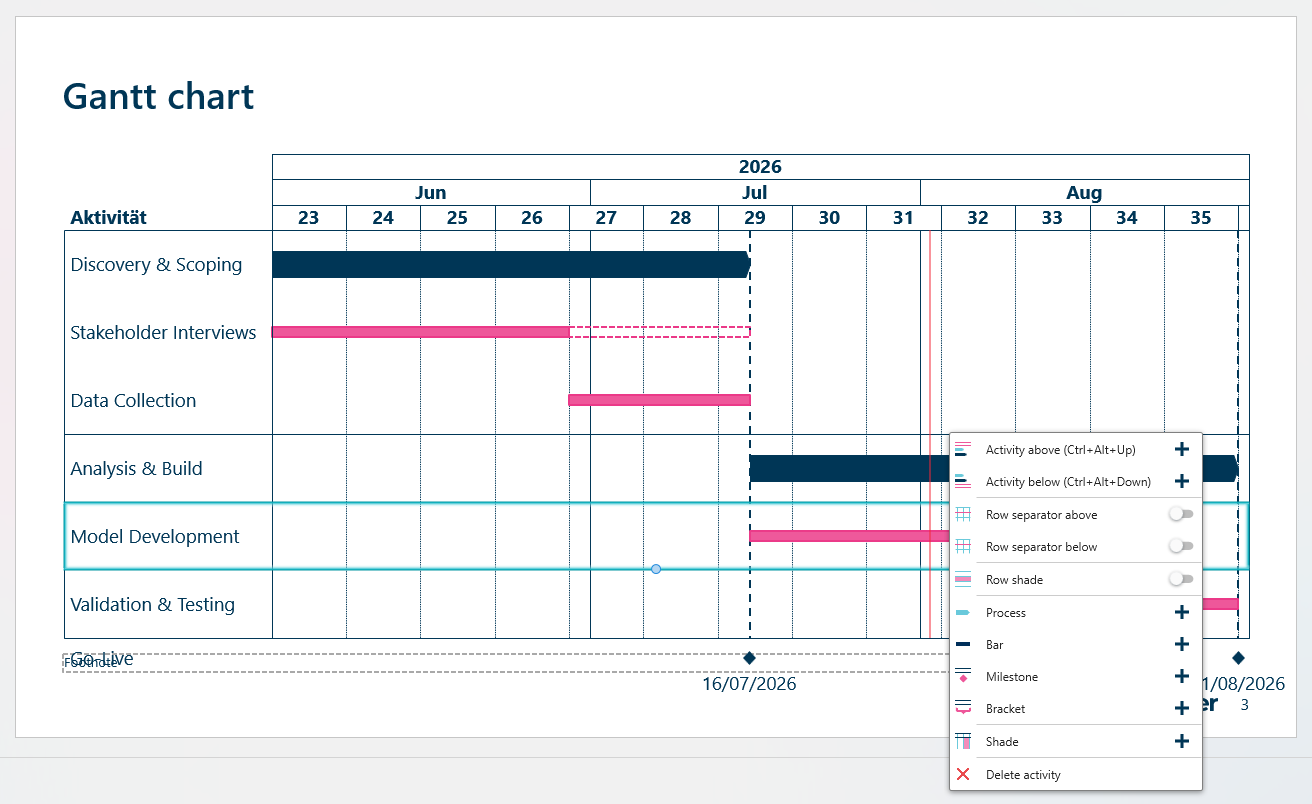
The Ampler Charts right-click menu in PowerPoint, revealing options to add processes, milestones, and other Gantt elements
With Ampler Charts, you build your Gantt chart directly inside PowerPoint using a structured data input panel. You enter tasks, durations, and milestones in a clean interface: no stacked bar workaround, no invisible series, no manually placed shapes.
Step 1: Open Ampler Charts inside PowerPoint
Once installed, Ampler Charts appears in your PowerPoint ribbon. Select the Gantt chart type from the chart builder panel.
Step 2: Enter your task data
Type your task names, start dates, and durations directly into the structured input panel. Add milestone markers as chart elements rather than as separately placed shapes.
Step 3: Link to Excel (optional)
For schedules that will change, link your Gantt chart to an Excel workbook. When the source data updates, you refresh the chart and the bars update automatically without manual reformatting.
Step 4: Apply consistent formatting
Ampler Charts applies your defined style settings across every chart in the deck. Bar colours, fonts, axis labels, and grid density stay consistent whether you have one Gantt chart or ten.
What you get that the other methods cannot provide
Milestone markers are chart elements, not free-floating shapes, so they stay in position when the chart is resized or when the slide dimensions change. Excel-linked data means schedule changes flow through to the chart without rebuilding it. And consistent formatting across charts means you are not re-applying styles manually each time you add a new project phase.
Ampler Charts also covers 40+ professional chart types including bar, line, and scatter charts, so you work in one environment rather than switching between native PowerPoint tools and separate chart builders.
How to Format Your Gantt Chart for Client-Ready Slides
Whether you use the native method, a template, or an add-in, the formatting principles for a consulting Gantt chart are the same.
Keep the time axis readable
Label your time axis at a consistent interval: weekly labels for a three-month project, monthly for a year-long engagement. Avoid daily labels on a long project; they crowd the axis and make the chart harder to read at a glance.
Group tasks into workstreams
Client Gantt charts rarely show a flat list of tasks. Organise tasks under clear workstream headers: Discovery, Analysis, Delivery, Implementation. Use indentation or colour coding to show hierarchy without adding a separate legend.
Limit your colour palette
Use one colour per workstream, maximum four or five distinct colours. If every task bar is a different colour, the chart becomes decorative rather than informative. The point of colour is to signal grouping, not variety.
Use milestones sparingly
A milestone marks a decision point or a deliverable, not every task completion. Placing milestone markers on every bar creates visual noise. Reserve them for steering committee reviews, sign-offs, and major handovers.
Match your slide’s typography
Task labels, axis labels, and legend text should use the same typeface as the rest of your deck. In consulting presentations, typographic consistency across slides signals attention to detail, and its absence signals the opposite.
Gantt Chart Best Practices for Consulting Decks
Consultants who produce a lot of project timeline slides tend to follow a short set of principles that separate readable charts from confusing ones.
Start with the client’s question, not the project plan. A Gantt chart in a client presentation should answer a specific question: when will this be done, who owns what, or where are the dependencies? Build the chart to answer that question, then remove anything that does not serve it.
Show the current date. A vertical line marking today’s date gives the chart an immediate reference point. It shows the client where the project stands relative to plan without requiring them to read every task bar.
Keep the slide title honest. The title above a Gantt chart should state the insight, not just the content. “Phase 2 completes ahead of original schedule” is more useful than “Project timeline.”
Update before every client meeting. A Gantt chart with outdated milestone dates undermines your credibility faster than almost anything else in a deck. Build a refresh habit into your pre-meeting prep.
For a deeper walkthrough of building professional charts for slide decks, the Ampler resources page has practical guides across chart types and slide formats.
Common Mistakes to Avoid
Using calendar dates on the axis when relative dates are clearer. For an internal planning deck, relative dates (Week 1, Week 2) are often easier to follow than specific calendar dates, especially for international teams with different date format conventions.
Overcrowding the chart. A Gantt chart with 25 tasks on a single slide is not readable. If your project has more than 15 to 18 tasks, split the chart by phase across multiple slides or create a summary chart that shows workstreams rather than individual tasks.
Ignoring dependencies. The most useful Gantt charts show where one task must finish before another can start. If your chart cannot show dependencies, consider whether a different visual format serves the client better.
Copying a chart from another deck without reformatting. Gantt charts borrowed from older projects carry their old formatting. Bar colours, fonts, and axis labels that do not match your current deck are easy for clients to spot and suggest a lack of rigour.
Resizing the chart without checking milestone positions. If you built milestones as manually placed shapes (as you must with the native PowerPoint method), always check their positions after any resize operation.
If you are working in an environment where your team uses an existing charting tool and needs to migrate charts to a consistent format, Ampler Charts includes a chart conversion feature. You can see how Ampler Charts handles chart conversion and how it fits into a broader slide automation workflow.
Start Building Better Gantt Charts
The native PowerPoint method gives you a working Gantt chart if you have the time and patience to set it up correctly. A pre-built template shortens the setup but shares the same structural limitations. For consultants who build multiple project timelines per engagement, or who need to update them frequently as the plan evolves, a dedicated add-in removes the repetitive manual work and ensures every chart meets client-presentation standards.
Ampler Charts is available as a standalone add-in or as part of the Ampler Suite — see the Ampler pricing page for current rates. A 30-day free trial is available with no credit card required.
See Ampler pricing and start your free trial to build your first consultant-grade Gantt chart today.
Frequently Asked Questions
Does PowerPoint have a built-in Gantt chart feature?
PowerPoint does not include a dedicated Gantt chart tool. The standard approach is to build one manually using a stacked bar chart, where one invisible series acts as a spacer to position task bars on a time axis. A PowerPoint charting add-in like Ampler Charts provides a native Gantt chart builder that skips this workaround entirely.
What is the fastest way to make a Gantt chart in PowerPoint?
The fastest method is to use a dedicated PowerPoint add-in that includes a Gantt chart builder with structured data input, so you enter your tasks and durations directly rather than constructing a stacked bar chart from scratch. Starting from a pre-built template is a useful middle ground if you prefer to stay within native PowerPoint tools.
How do consultants format Gantt charts for client presentations?
Consultants group tasks into clearly labelled workstreams, limit bar colours to one per workstream, use milestone markers only for key decision points or deliverables, and mark the current date with a vertical reference line. The chart title states an insight about the timeline rather than simply describing the chart’s contents.
Does Ampler Charts support Gantt charts?
Ampler Charts is a PowerPoint add-in that includes a dedicated Gantt chart builder alongside 40+ other professional chart types including waterfall and Mekko charts. It supports Excel-linked data so charts update automatically when the project schedule changes, and it keeps milestone markers in position when the chart is resized.
How is a Gantt chart different from a project timeline slide?
A project timeline slide typically shows a linear sequence of high-level milestones or phases, while a Gantt chart shows individual tasks with explicit start dates, durations, and sometimes dependencies displayed as horizontal bars against a time axis. Gantt charts carry more detail and are better suited to project management and workstream planning slides.
Can I update a PowerPoint Gantt chart automatically when the schedule changes?
With the native stacked bar method or a pre-built template, updates are entirely manual: you edit the data directly in PowerPoint’s chart editor each time the schedule changes. Ampler Charts supports Excel-linked Gantt charts, so when your source data updates you can refresh the chart without rebuilding it by hand.