Create bubble charts to easily present your data insights
In this detailed guide, we will explain everything you need to know about bubble charts. By the end of this guide, you will be able to create bubble charts in both PowerPoint and Excel. Let’s start from the beginning!
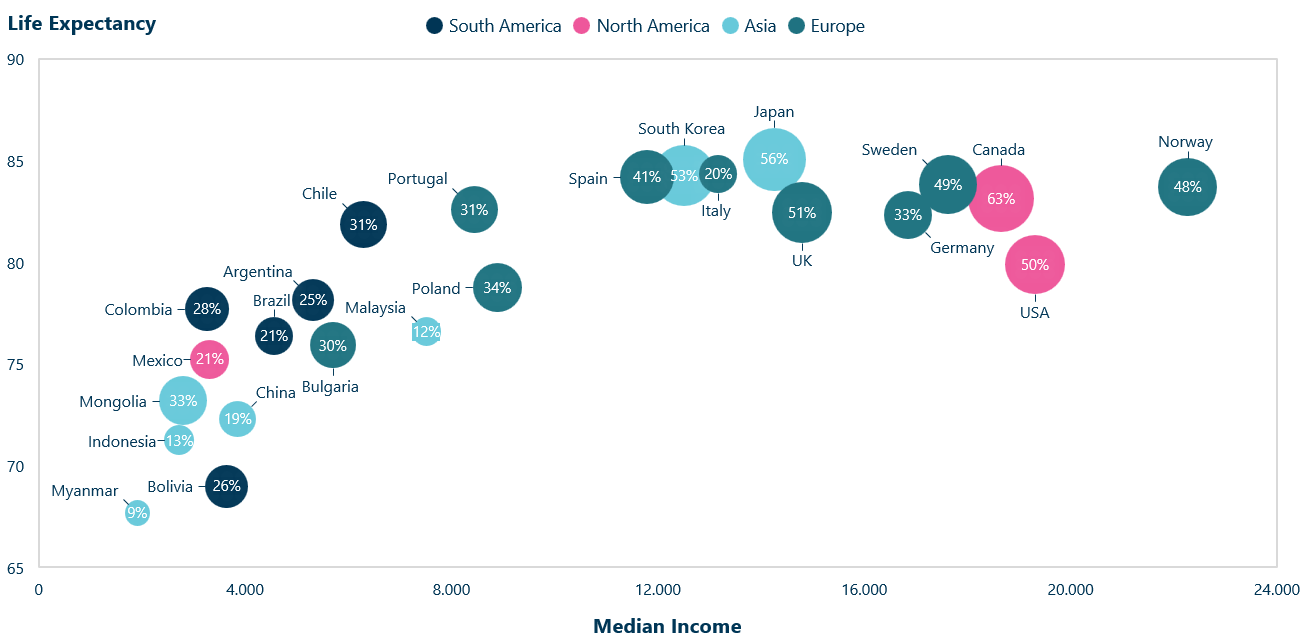
Example of a Bubble chart showing percentage of college degree, life expectancy and median income
What is a Bubble Chart?
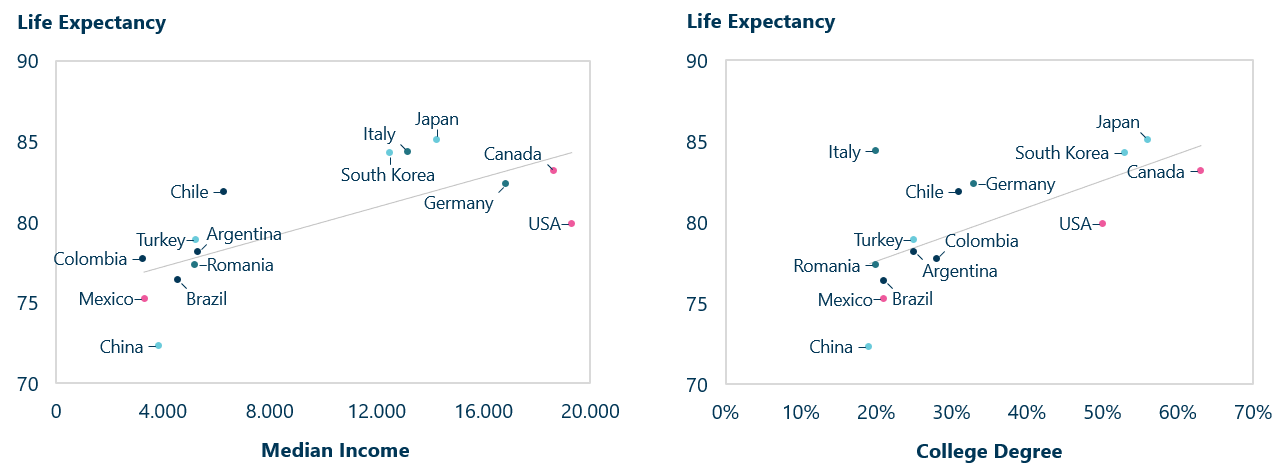
A bubble chart, sometimes referred to as a bubble plot, is an extension of the scatter plot with three variables instead of two. Each of the bubbles on the chart correspond with a single data point in your dataset. The variable values for each of the bubbles are indicated by their vertical position, horizontal position and the size of the bubbles. Like a scatter plot, this chart type don’t have a category axis.
The bubbles adds a third dimension, allowing you to compare three pairwise relationships – for example, X and Y, or the overall relationship between all three variables. If you wanted to do the same with a scatter plots, you would need multiple of them. With a single effective bubble chart you only need one!
Use Cases of Bubble Charts
There are many different use cases for bubble charts. Everything from market analysis and sports performance to air quality monitoring. All you need is three numeric variables that have some sort of meaningful relationship. Let’s look at some examples.
Market Analysis
When conducting a market analysis, it’s a good idea to use a bubble chart instead of a scatter plot, as it can display more financial data, making the comparison more comprehensive and insightful.
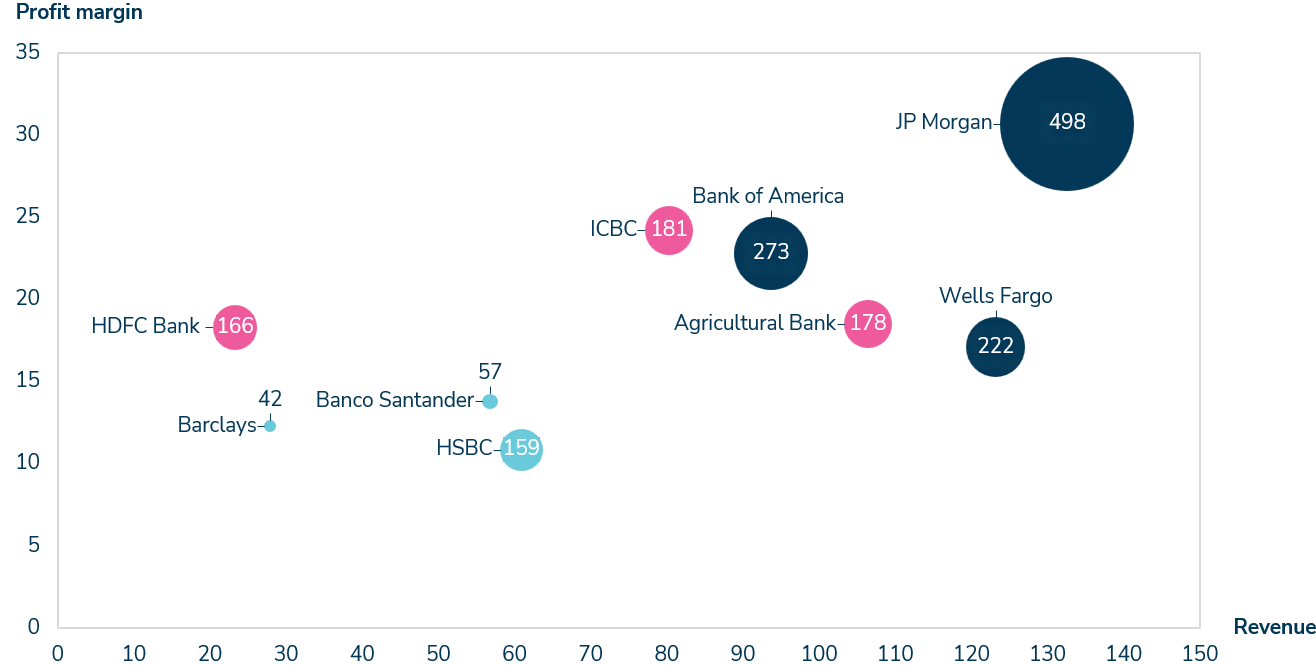
In this example, we compare the biggest American, Asian and European banks:
The X-axis represents revenue
The Y-Axis represents the profit margin
The bubble size represents market cap (a measure of the company’s value on the stock market)
The color of the bubbles indicates the region of the banks
Comparison of banks in a bubble chart
As we can see, JP Morgan’s revenue, profit margin and market cap is much larger than any other bank in the world. Furthermore, American banks, in general have a larger market cap as seen by the bigger bubbles. European banks, on the other hand have smaller profit margin, revenue and market caps as indicated by the size of the bubbles and their position on y and x-axis.
Portfolio Analysis
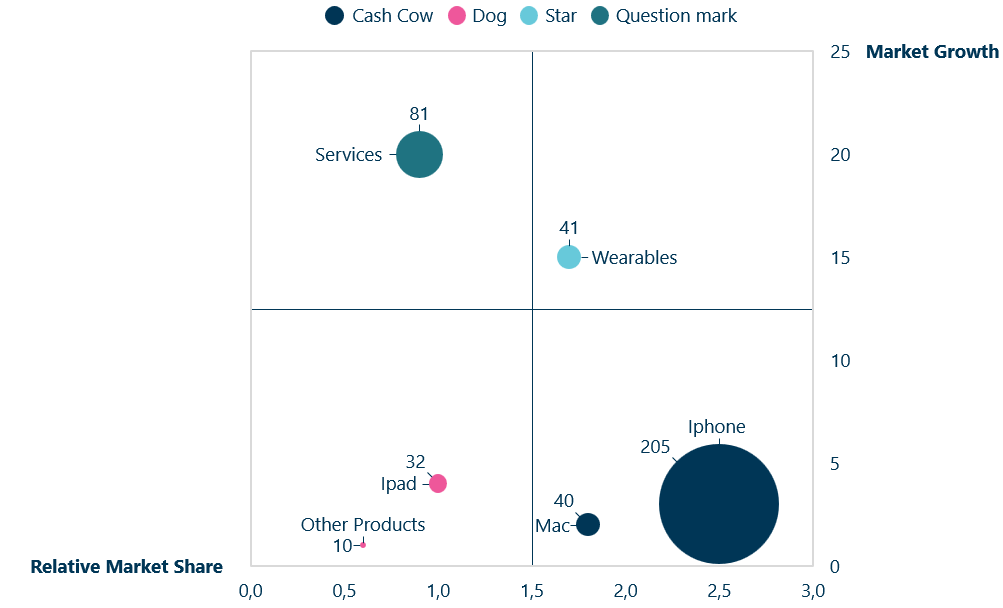
Another use of a bubble chart is a portfolio analysis, such as the world-famous BCG Matrix, which shows relative market share on the X-axis and the market growth on the Y-axis.
The model divides products into four quadrants:
Dog: Low relative market share and market growth
Cash Cow: High relative market share but low market growth
Question Mark: Low relative market share but high market growth
Star: High relative market share and high market growth
Using this framework, companies can determine opportunities and risks of their current market segments. In a bubble chart form, we can add revenue as z-values (bubble sizes), helping visualizing the data more effectively.
In our example, we highlight Apple’s product lines in the matrix
Boston Matrix bubble chart
As seen on the chart, iPhones are a cash cow and remain Apples most dominant revenue stream, while wearables are a star, as it has high market growth and Apple has relatively high market share.
The Boston Matrix is a useful tool for portfolio analysis, but remember that other aspects may have to be taken into account. For example, although “other products” may be classified as a dog, there may be synergies which this chart don’t highlight. Also, by incorporating a bubble chart, it’s clear just how vital iPhones are for the company’s revenue. This won’t be highlighted in a normal Boston Matrix.
Bubble Chart with ROS/RMS
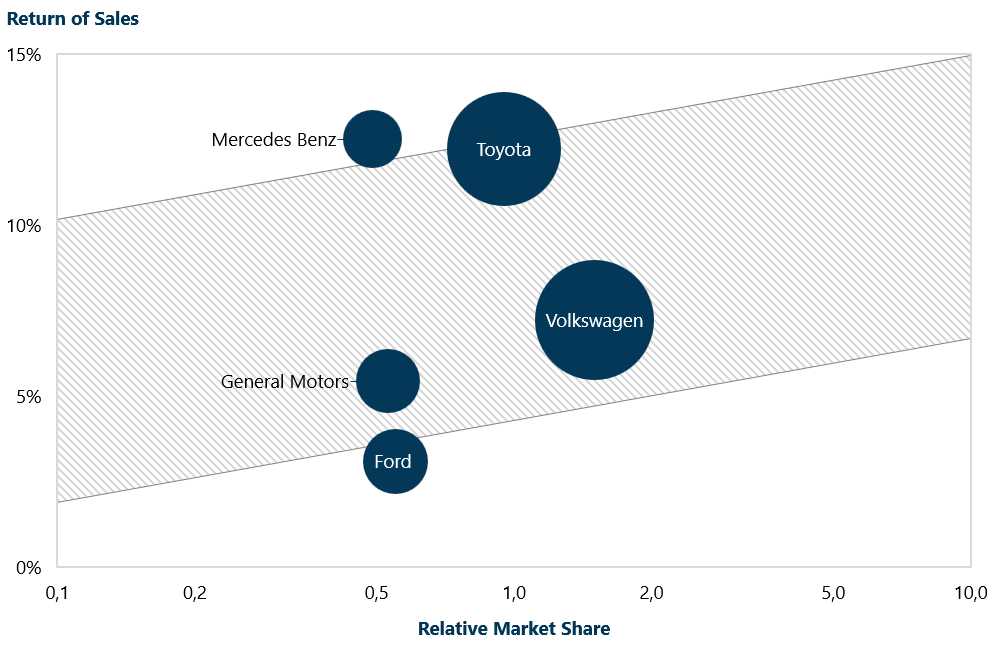
Another common use of a bubble chart is to utilize an RMS/ROS band, which illustrates the expected profitability range given a company’s relative market share.
In the chart below, using car companies as an example, we can see that Mercedes Benz and Toyota overperform on return of sales, as they are above the band. Ford, on the other hand, is below the band, as they underperform in regards to the expected return of sales at their relative market share.
Remember, the X-axis should be logarithmic (each unit increase represents a multiplication of the previous value). In Ampler, you can simply toggle on an RMS/ROS band.
Bubble chart with ROS/RMS band
Bubble Chart with Negative Values
You’re probably wondering, what can i do if the bubble chart’s Z-values are negative? An area can’t represent negative values? Although bubble charts aren’t ideal for displaying these negative values, it can still be done! In the following example, we’ll show you a bubble chart with incorporating negative values.
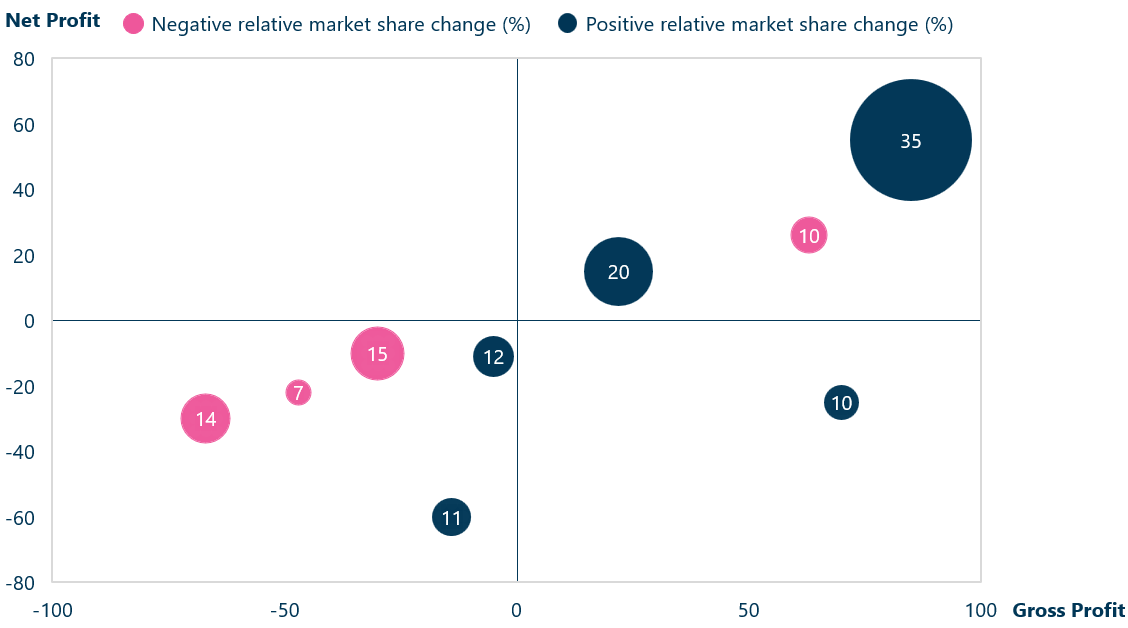
Lets use an example of different companies financial performance
X axis: Gross profit ($m)
Y axis: Net Profit ($m)
Bubble size: Market share change (%) – a red bubble represents negative Z-values
Remember, if the Y-values are negative, the data points move to the left of the Y-axis. If the X-values are negative, they move below the X-axis. The vertical and horizontal lines help determine the positive values from the negative ones.
Bubble chart with negative z-values
As seen on the chart, the relative market share change can be unrelated to a company’s net profit and gross profit. Some reasons include: intentionally sacrifice profitability for growth or the sales is not increasing at the same rate as competitors. Nevertheless, if relative market share is declining, it should be cause of concern, or if rising a sign of optimism.
A scatter chart would highlight the correlation between gross profit and net profit more clearly, but it won’t tell us if the company is actually gaining or losing relative market share!
Packed Circle Chart
In our last example, we will look at a related chart type called a packed circle chart. Like a bubble chart, the data points are displayed as circles, with the size indicating the magnitude of the chosen variable.
But unlike a traditional bubble chart, this chart type doesn’t have X or Y values. Rather, the circles are packed together either by being close or in a larger circle, which helps to avoid overlap.
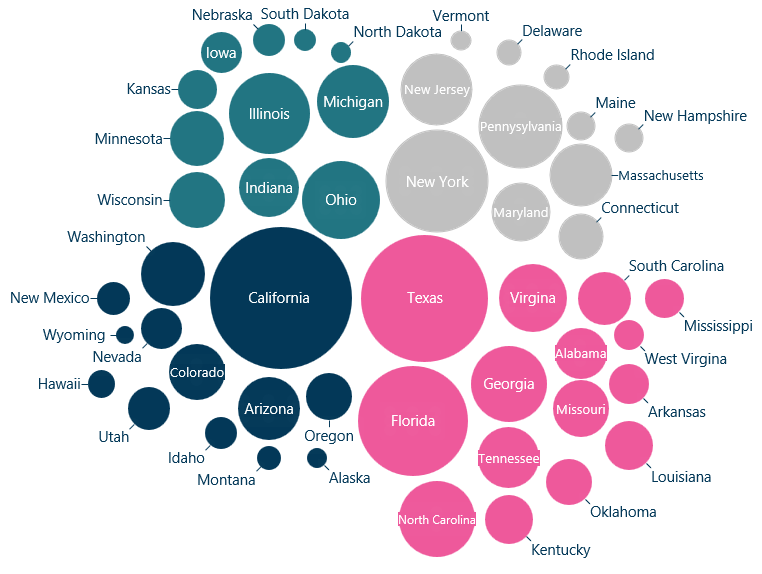
The example below shows the US population (size of bubbles) divided by state and region (color) using this chart type:
Packed circle chart showing the US population
How to Create a Bubble Chart in PowerPoint: Step-by-Step
Let’s now turn to how you create these charts. Through there are different options, we will in this guide use Ampler Charts, as its one of the best chart tools out there. We will use this add-in, but the main steps are more less the same, no matter what add-in you use.
After the main guide, we will show you how to make a bubble chart in PowerPoint and Excel without an add-in.
Watch the video or read through the guide below to learn how to make a great bubble chart.
Step 1: Assert if it’s the Best Option
To determine if a bubble chart is suitable for your data, ensure you have three numeric variables and you aim to analyze patterns between them or highlight key data points in the data set.
Also, evaluate the dataset’s structure – if the values are too closely associated, the chart may be difficult to interpret. Most importantly, the Z variable or bubble sizes need to be important for interpreting the point of the chart. if not, better use a more simple charts like scatter plots.
Step 2: Insert Bubble Chart
You can use PowerPoint’s own native bubble chart, which we will show later. For the main guide, we will as mentioned use Ampler. However, the steps are more less the same.
To create a bubble chart using Ampler, simply plot it in the following way:
Click on the Ampler ribbon
Click on Ampler Charts
Choose bubble chart and insert in PowerPoint
Step 3: Input Data Points
To change the data, do the following:
Double-click on the chart to open the data table
With the chart open, plot in the data set (you need three columns of data)
To change data points simply click and change it.
The bubbles and their positioning will instantly adjust to fit the data structure. Remember, the bubble sizes are the third data series called “Size” in Ampler.
Tip: If you want to highlight important data points, you can use a label on the bubbles
Step 4: Customize Your Bubble Chart
After plotting in your data values, it’s time to customize the chart:
Rename the axes by changing the column headings
Change the axes’ number format to match the data values
Add a fourth categorical variable by using the “Group” section in the data table
Tip: Use color as a distinction when grouping.
Step 5: Finalize Chart Elements
Time to finalize your chart! Make sure not to include unnecessary information or add a chart element that isn’t needed. However, remember to add or tweak the following:
Scale the chart and the bubbles, so all the data points can be seen clearly
Toggle on/off text and size labels (make sure to change the number format)
Add a title and legend to clarify the context that the chart shows
There you have it – a great bubble chart!
Other Ampler Bubble Chart Features
In Ampler, you also have the following features for customizing your bubble charts:
Toggle on/off axes, gridlines, tick marks and axis breaks to make the chart more readable
Toggle on a trendline to show the general direction of the data
Create a vertical and horizontal lines to highlight specific threshold, target values or divisions
Divide the chart into a matrix that helps segmenting the data into distinct areas
Make a bubble size legend to clarify their sizes
Add a ROS/RMS band to illustrate the expected probability range
Convert the scale to a logarithmic scale, making easier to compare values
Add value labels to see X and Y values of bubbles
Let’s now turn to how you build bubble charts in native PowerPoint and Excel.
How to Create a Bubble Chart in PowerPoint Without Add-Ins
To create a native bubble chart in PowerPoint is quite easy and be done by a few steps:
Click on the “Insert” tab and choose “Charts”
Under “X Y (scatter)” choose “Bubble”
Enter the data values into the spreadsheet – the chart will scale automatically.
Scale the axes and the bubbles to make the chart more readable
Customize the chart elements by changing colors and fonts
Remember to label the x and y axes
Toggle on the data labels to show the size variable
If you want to insert text in a bubble or group them in a categorical variable by color, you have to do it manually or split the data into data series’
Give the chart a title
There you have it – a bubble chart in PowerPoint! While the native charts in PowerPoint are sufficient, we will recommend using a add-in like Ampler to make them faster and more visual appealing.
How to Create Bubble Charts in Excel Without Add-Ins
If you rather want to create a bubble chart direct in Excel, you can use its build in chart tool – just follow the guide below:
Open data sheet: Make sure to have at least four rows or columns and three values for each bubble in order to generate the chart. Ensure the first column are X values, and corresponding Y values and bubble sizes are listed in adjacent columns
Select the data series: Don’t highlight row or column headers in the data selection
Select the bubble chart: In the Insert tab in the Charts group
Scale the bubbles: Simply by clicking on them and type the shape size
Scale the axes: Under Axis Options, type in your desired scale
To add axes:
Select “Add Chart element” under the Chart Design tab
Then choose “Axis Titles” to add a vertical and horizontal axis
If you want to text label the bubbles, do the following:
Select “More data labels options” in the “Data Label” section under “Chart Elements” in the Chart Design tab
In the Format tab select “Value for Cells” and then unclick “Y value”
If you want color the bubbles according to a categorical variable and/or name the bubbles, you will have to fill and insert text manually!
Just like that, an Excel bubble chart! We will now highlight best practices, advantages as well as disadvantages of these charts.
Best Practices when making Bubble Charts
There are some clear guidelines to check for, to make sure you have made a effective chart for displaying data:
Ensure all three numerical variables provide meaningful insight
Avoid overcrowding the chart with bubbles. If there are too many, use scatter plots instead
Make sure to include the legend and axis labels. Label key data points directly if it amplifies interpretation
Display zero or negative values carefully, especially for the bubble sizes. Use color codding, labels or alternative shapes
Use appropriate scaling for the size of the bubbles, for example, by basing the bubble area on data values or normalizing extreme ranges to avoid misleading representation
Advantages and Disadvantages of Using a Bubble Chart
Like any other chart type there are some advances and disadvantages. Lets start with the advantages of these charts:
A bubble chart makes you able to add a third additional dimension or variable to your visualization
It can help show correlating relationships, clusters and outliers in the data points
Can visualize a single fourth categorical fourth variable by the use of color
Some of the disadvantages are:
If you have to many data points, it gets cluttered
Likewise, if the bubbles have similar Y, X or Z values, it can also become cluttered
Visualizing negative Z values (Bubble sizes) is difficult
Scaling of can be misleading if the bubbles are exaggerated
Humans have been shown to be ill-equipped to make accurate visual comparison based on area
They aren’t suitable for non-numeric variables
Alternatives to Bubble Charts
As discussed in the former sections, in some cases, it’s better to opt for other charts, as bubble charts can become to cluttered with large datasets or when you need to make precise comparisons between variables. Let’s look at some examples!
Scatter Plot aka Scatter Chart
A chart type showing the relationship between two numeric variables instead of three. The data points are represented only by x-value and y-values. Although, this chart lack a third variable, its way more clear if there is a relationship between variables.
Scatter Plots with trendlines
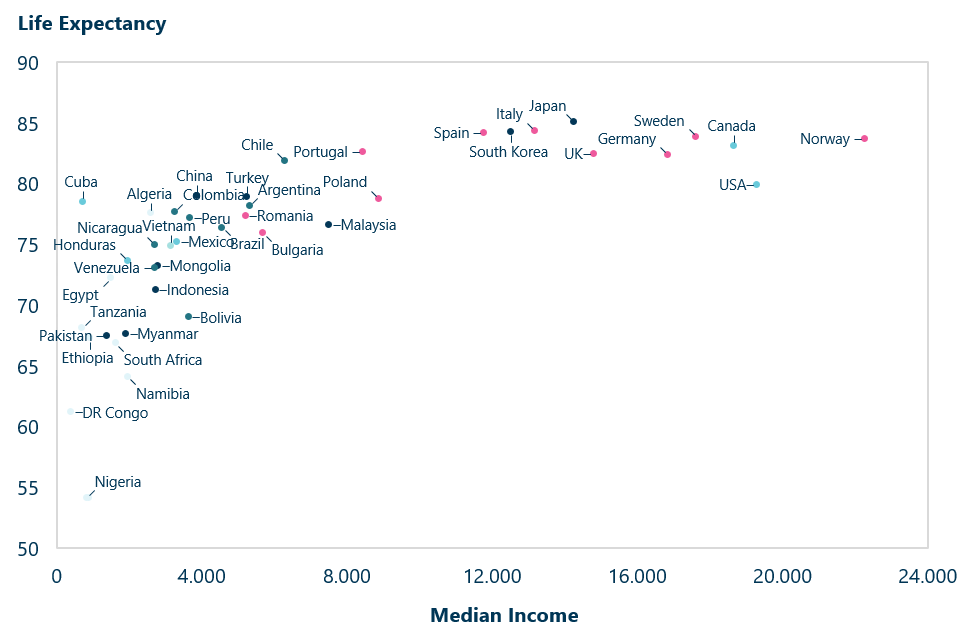
Another important point of using a scatter plot is the simple fact that you can plot way more data points as seen below:
Scatter plot with more data points
With more data points, it becomes clear that the relationship isn’t in fact linear. Furthermore, the inclusion of African nations highlights that median income isn’t as correlated with life expectancy as first observed.
It’s important to evaluate what you want to tell with your chart. If an additional variable doesn’t enhance the audience’s understanding of the main takeaway of the chart, it’s better to leave it out and use a scatter plot rather than a bubble chart.
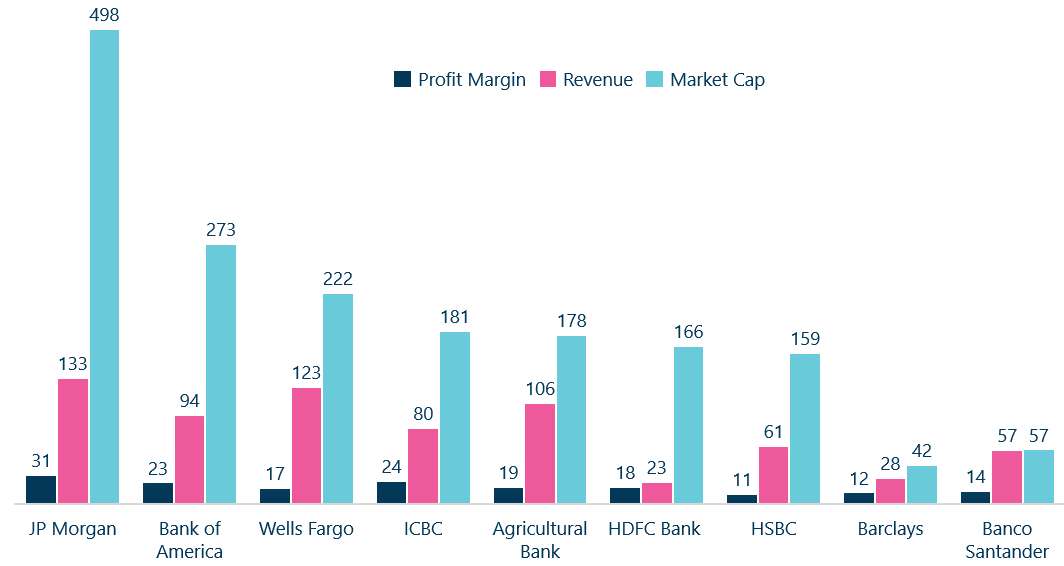
Clustered Column Chart or Bar Chart
This chart type is a great alternative, especially if you want to compare variables directly. X and Y variables can be hard to decipher from a bubble chart, where as in a clustered bar or column chart, they are way more clear to interpret. Also, you don’t run into a overlapping problem.
Let’s use the former example of market analysis of banks:
It’s clear that it’s much easier to compare profit margins and revenue than in the bubble chart. However, in the bubble chart, it’s more clear that JP Morgan is an outlier not only in market cap but on all variables.
Conclusion: Bubble Charts are Effective for Multidimensional Data
Instead of using multiple scatter plots, a simple bubble chart can represent data in the same chart by providing a multidimensional view of data. This makes them ideal for analyzing relationships between multiple variables at once.
Another strength is the chart highlights outliers at multiple dimensions. If the outliers are on Y or X axis, it shows a data point’s deviation from the observed trend and relationship. If data points deviate in the Z value, it illuminates a disproportionation magnitude. Most significantly, a bubble chart can show extreme anomalies where a data point deviates on three variables.
Like scatter plots, bubble charts visualize clusters in data, making it easier to identify patterns that are hard to detect using other chart types.
In summary, bubble charts stand out among chart types for their ability to visualize multiple variables more effectively than scatter plots. They are perfect for uncovering patterns and emphasizing outliers. However, be aware of having too many or too closely related data points, as this can clutter the chart making insights hard to interpret.
With Ampler, creating visually appealing charts has never been easier! Ampler has many other chart options and features. For more information, visit: Ampler Charts for PowerPoint
This website uses cookies in order to improve the user experience. When you continue to use this site, you accept the use of cookies. Read more about our cookie policy here.
 Tip: Use color as a distinction when grouping.
 There you have it – a great bubble chart!
 Scale the axes and the bubbles to make the chart more readable
 There you have it – a bubble chart in PowerPoint! While the native charts in PowerPoint are sufficient, we will recommend using a add-in like Ampler to make them faster and more visual appealing.
 To add axes:
  Just like that, an Excel bubble chart! We will now highlight best practices, advantages as well as disadvantages of these charts.